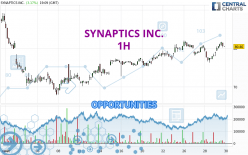
Londinia Opportunities Analyses - 08/29/2024 (GMT) SYNAPTICS INC. - 1H
- U.S. Stocks
- Timeframe : 1H
- - Analysis generated on
- Status : INVALID
Summary of the analysis
Trends
Short term:
Strongly bullish
Underlying:
Strongly bullish
Technical indicators
78%
0%
22%
My opinion
Bullish above 79.80 USD
My targets
82.64 USD (+2.54%)
85.28 USD (+5.82%)
My analysis
The bullish trend is currently very strong on SYNAPTICS INC.. As long as the price remains above the support at 79.80 USD, you could try to benefit from the boom. The first bullish objective is located at 82.64 USD. The bullish momentum would be boosted by a break in this resistance. Buyers would then use the next resistance located at 85.28 USD as an objective. Crossing it would then enable buyers to target 88.45 USD. Be careful, given the powerful bullish rally underway, excesses could lead to a possible correction in the short term. If this is the case, remember that trading against the trend may be riskier. It would seem more appropriate to wait for a signal indicating reversal of the trend.
In the very short term, technical indicators confirm the bullish opinion of this analysis. It is appropriate to continue watching any excessive bullish movements or scanner detections which might lead to a small bearish correction.
Force
0
10
8.6

Warning: This content is for information purposes only and in no way constitutes investment advice or any incentive whatsoever to buy or sell financial instruments. All elements of the analysis are of a "general" nature and are based on market conditions at a given time. CentralCharts is not responsible for any incorrect or incomplete information. Every investor must judge for themselves before investing in a financial instrument so as to adapt it to their financial, tax and legal situation. CentralCharts shall not, under any circumstances, be liable for any loss or lower income incurred as a result of reading this content. Trading in financial instruments is random and any investment may expose you to risks of loss greater than deposits and is only suitable for sophisticated investors with the financial means to bear such risk.
Additional analysis
Quotes
The SYNAPTICS INC. rating is 80.59 USD. The price has increased by +3.33% since the last closing and was traded between 78.04 USD and 81.67 USD over the period. The price is currently at +3.27% from its lowest and -1.32% from its highest.78.04
81.67
80.59
The Central Gaps scanner detects a bullish opening. A small advantage for buyers in the very short term.
Bullish opening
Type : Bullish
Timeframe : Openning
A study of price movements over other periods shows the following variations:
Technical
A technical analysis in 1H of this SYNAPTICS INC. chart shows a strongly bullish trend. The signals given by the moving averages are 92.86% bullish. This strong bullish trend is confirmed by the strong signals currently being given by short-term moving averages. The Central Indicators scanner does not detect any result on moving averages that would impact this trend.
Technical indicators are strongly bullish, suggesting that the price increase should continue.
Central Indicators, the detector scanner for these technical indicators recently detected a signal:
Pivot points : price is over resistance 1
Type : Neutral
Timeframe : 1 hour
Central Patterns, the scanner specializing in chart patterns, did not identify any signals.
The Central Candlesticks scanner, specialised in Japanese candlesticks, did not identify any signals.
ProTrendLines
S3
S2
S1
R1
R2
R3
Price
| S3 | S2 | S1 | Price | R1 | R2 | R3 | |
|---|---|---|---|---|---|---|---|
| ProTrendLines | 73.75 | 77.40 | 79.80 | 80.59 | 85.28 | 88.45 | 90.63 |
| Change (%) | -8.49% | -3.96% | -0.98% | - | +5.82% | +9.75% | +12.46% |
| Change | -6.84 | -3.19 | -0.79 | - | +4.69 | +7.86 | +10.04 |
| Level | Major | Minor | Major | - | Major | Minor | Minor |
Pivot points can also be used to set your price objectives. Here is the price situation in relation to pivot points:
Daily
| Pivot points | S3 | S2 | S1 | PP | R1 | R2 | R3 |
|---|---|---|---|---|---|---|---|
| Standard | 71.95 | 74.12 | 76.06 | 78.23 | 80.17 | 82.34 | 84.28 |
| Camarilla | 76.86 | 77.24 | 77.61 | 77.99 | 78.37 | 78.74 | 79.12 |
| Woodie | 71.83 | 74.06 | 75.94 | 78.17 | 80.05 | 82.28 | 84.16 |
| Fibonacci | 74.12 | 75.69 | 76.66 | 78.23 | 79.80 | 80.77 | 82.34 |
Weekly
| Pivot points | S3 | S2 | S1 | PP | R1 | R2 | R3 |
|---|---|---|---|---|---|---|---|
| Standard | 71.18 | 73.28 | 76.91 | 79.01 | 82.64 | 84.74 | 88.37 |
| Camarilla | 78.96 | 79.49 | 80.02 | 80.54 | 81.07 | 81.59 | 82.12 |
| Woodie | 71.95 | 73.66 | 77.68 | 79.39 | 83.41 | 85.12 | 89.14 |
| Fibonacci | 73.28 | 75.47 | 76.82 | 79.01 | 81.20 | 82.55 | 84.74 |
Monthly
| Pivot points | S3 | S2 | S1 | PP | R1 | R2 | R3 |
|---|---|---|---|---|---|---|---|
| Standard | 68.96 | 76.91 | 82.11 | 90.06 | 95.26 | 103.21 | 108.41 |
| Camarilla | 83.70 | 84.91 | 86.12 | 87.32 | 88.53 | 89.73 | 90.94 |
| Woodie | 67.60 | 76.22 | 80.75 | 89.37 | 93.90 | 102.52 | 107.05 |
| Fibonacci | 76.91 | 81.93 | 85.03 | 90.06 | 95.08 | 98.18 | 103.21 |
Numerical data
The following is the status of the technical indicators and moving averages at the time of publication of this technical analysis:
Technical indicators
Moving averages
| RSI (14): | 55.41 | |
| MACD (12,26,9): | 0.3700 | |
| Directional Movement: | 9.74 | |
| AROON (14): | 57.15 | |
| DEMA (21): | 80.00 | |
| Parabolic SAR (0,02-0,02-0,2): | 77.22 | |
| Elder Ray (13): | 1.07 | |
| Super Trend (3,10): | 78.15 | |
| Zig ZAG (10): | 80.56 | |
| VORTEX (21): | 0.9500 | |
| Stochastique (14,3,5): | 91.70 | |
| TEMA (21): | 80.08 | |
| Williams %R (14): | -20.30 | |
| Chande Momentum Oscillator (20): | 1.04 | |
| Repulse (5,40,3): | 0.8900 | |
| ROCnROLL: | 1 | |
| TRIX (15,9): | 0.0100 | |
| Courbe Coppock: | 1.48 |
| MA7: | 79.46 | |
| MA20: | 75.76 | |
| MA50: | 83.55 | |
| MA100: | 87.05 | |
| MAexp7: | 80.32 | |
| MAexp20: | 79.57 | |
| MAexp50: | 78.85 | |
| MAexp100: | 78.38 | |
| Price / MA7: | +1.42% | |
| Price / MA20: | +6.38% | |
| Price / MA50: | -3.54% | |
| Price / MA100: | -7.42% | |
| Price / MAexp7: | +0.34% | |
| Price / MAexp20: | +1.28% | |
| Price / MAexp50: | +2.21% | |
| Price / MAexp100: | +2.82% |
Quotes :
-
15 min delayed data
-
Actions NASDAQ
News
Don't forget to follow the news on SYNAPTICS INC.. At the time of publication of this analysis, the latest news was as follows:
- Glancy Prongay & Murray LLP Announces Investigation of Synaptics Incorporated
- Glancy Prongay & Murray LLP Announces Investigation of Synaptics Inc.
- SHAREHOLDER ALERT: Purcell Julie & Lefkowitz LLP Is Investigating Synaptics Incorporated for Potential Breaches Of Fiduciary Duty By Its Board of Directors
- Synaptics Incorporated to Host Earnings Call
-
 Synaptics CEO: Better Fingerprint Solutions | Mad Money | CNBC