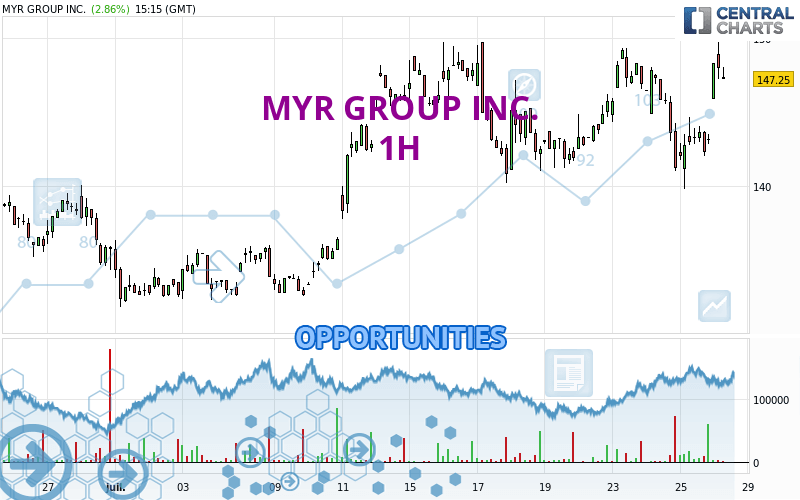
Londinia Opportunities Analyses - 07/26/2024 (GMT) MYR GROUP INC. - 1H
- U.S. Stocks
- Timeframe : 1H
- - Analysis generated on
- Status : INVALID
Summary of the analysis
Trends
Short term:
Strongly bullish
Underlying:
Strongly bullish
Technical indicators
72%
11%
17%
My opinion
Bullish above 145.39 USD
My targets
149.72 USD (+1.61%)
151.61 USD (+2.89%)
My analysis
MYR GROUP INC. is part of a very strong bullish trend. Traders may consider trading only long positions (at the time of purchase) as long as the price remains well above 145.39 USD. The next resistance located at 149.72 USD is the next bullish objective to be reached. A bullish break in this resistance would boost the bullish momentum. The bullish movement could then continue towards the next resistance located at 151.61 USD. After this resistance, buyers could then target 159.08 USD. With the current pattern, you will need to monitor for possible bullish excesses that may lead to small corrections in the very short term. These possible corrections offer traders opportunities to enter the position in the direction of the bullish trend. Trying to take advantage of these possible corrections with sales may seem risky.
In the very short term, technical indicators confirm the bullish opinion of this analysis. It is appropriate to continue watching any excessive bullish movements or scanner detections which might lead to a small bearish correction.
Force
0
10
8

Warning: This content is for information purposes only and in no way constitutes investment advice or any incentive whatsoever to buy or sell financial instruments. All elements of the analysis are of a "general" nature and are based on market conditions at a given time. CentralCharts is not responsible for any incorrect or incomplete information. Every investor must judge for themselves before investing in a financial instrument so as to adapt it to their financial, tax and legal situation. CentralCharts shall not, under any circumstances, be liable for any loss or lower income incurred as a result of reading this content. Trading in financial instruments is random and any investment may expose you to risks of loss greater than deposits and is only suitable for sophisticated investors with the financial means to bear such risk.
Additional analysis
Quotes
MYR GROUP INC. rating 147.35 USD. On the day, this instrument gained +2.93% and was traded between 145.88 USD and 149.74 USD over the period. The price is currently at +1.01% from its lowest and -1.60% from its highest.145.88
149.74
147.35
A bullish gap was detected at the opening by the Central Gaps scanner. There are a lot of buyers and they have the upper hand in the very short term.
Opening Gap UP
Type : Bullish
Timeframe : Openning
So that you have an overall view of the price change, here is a table showing the variations over several periods:
New HIGH record (1 month)
Type : Bullish
Timeframe : Weekly
Technical
A technical analysis in 1H of this MYR GROUP INC. chart shows a strongly bullish trend. 92.86% of the signals given by moving averages are bullish. The overall trend is supported by the strong bullish signals from short-term moving averages. The Central Indicators market scanner currently does not detect any result that concerns moving averages.
In fact, 13 technical indicators on 18 studied are currently bullish. Caution: the Central Indicators scanner currently detects an excess:
Williams %R indicator is overbought : over -20
Type : Neutral
Timeframe : 1 hour
Pivot points : price is over resistance 1
Type : Neutral
Timeframe : 1 hour
Pivot points : price is over resistance 1
Type : Neutral
Timeframe : Weekly
MACD indicator is back over 0
Type : Bullish
Timeframe : 1 hour
The analysis of the price chart with Central Patterns scanners does not return any result.
Central Candlesticks, the scanner specialised in Japanese candlesticks, detects this inversion signal that could impact the current short-term trend:
Doji
Type : Neutral
Timeframe : 1 hour
ProTrendLines
S3
S2
S1
R1
R2
R3
Price
| S3 | S2 | S1 | Price | R1 | R2 | R3 | |
|---|---|---|---|---|---|---|---|
| ProTrendLines | 140.92 | 145.39 | 147.13 | 147.35 | 149.72 | 151.61 | 159.08 |
| Change (%) | -4.36% | -1.33% | -0.15% | - | +1.61% | +2.89% | +7.96% |
| Change | -6.43 | -1.96 | -0.22 | - | +2.37 | +4.26 | +11.73 |
| Level | Intermediate | Minor | Minor | - | Major | Major | Intermediate |
Attention could also be paid to pivot points to set price objectives:
Daily
| Pivot points | S3 | S2 | S1 | PP | R1 | R2 | R3 |
|---|---|---|---|---|---|---|---|
| Standard | 135.46 | 137.61 | 140.38 | 142.53 | 145.30 | 147.45 | 150.22 |
| Camarilla | 141.80 | 142.25 | 142.70 | 143.15 | 143.60 | 144.05 | 144.50 |
| Woodie | 135.77 | 137.77 | 140.69 | 142.69 | 145.61 | 147.61 | 150.53 |
| Fibonacci | 137.61 | 139.49 | 140.65 | 142.53 | 144.41 | 145.57 | 147.45 |
Weekly
| Pivot points | S3 | S2 | S1 | PP | R1 | R2 | R3 |
|---|---|---|---|---|---|---|---|
| Standard | 128.60 | 134.39 | 138.13 | 143.92 | 147.66 | 153.45 | 157.19 |
| Camarilla | 139.24 | 140.11 | 140.99 | 141.86 | 142.73 | 143.61 | 144.48 |
| Woodie | 127.57 | 133.88 | 137.10 | 143.41 | 146.63 | 152.94 | 156.16 |
| Fibonacci | 134.39 | 138.03 | 140.28 | 143.92 | 147.56 | 149.81 | 153.45 |
Monthly
| Pivot points | S3 | S2 | S1 | PP | R1 | R2 | R3 |
|---|---|---|---|---|---|---|---|
| Standard | 104.22 | 119.26 | 127.48 | 142.52 | 150.74 | 165.78 | 174.00 |
| Camarilla | 129.31 | 131.45 | 133.58 | 135.71 | 137.84 | 139.97 | 142.11 |
| Woodie | 100.82 | 117.56 | 124.08 | 140.82 | 147.34 | 164.08 | 170.60 |
| Fibonacci | 119.26 | 128.14 | 133.63 | 142.52 | 151.40 | 156.89 | 165.78 |
Numerical data
The following is the status of the technical indicators and moving averages at the time of publication of this technical analysis:
Technical indicators
Moving averages
| RSI (14): | 58.17 | |
| MACD (12,26,9): | 0.3000 | |
| Directional Movement: | 6.95 | |
| AROON (14): | 50.00 | |
| DEMA (21): | 145.36 | |
| Parabolic SAR (0,02-0,02-0,2): | 140.32 | |
| Elder Ray (13): | 2.11 | |
| Super Trend (3,10): | 142.15 | |
| Zig ZAG (10): | 147.34 | |
| VORTEX (21): | 0.8400 | |
| Stochastique (14,3,5): | 86.16 | |
| TEMA (21): | 145.50 | |
| Williams %R (14): | -24.05 | |
| Chande Momentum Oscillator (20): | 1.54 | |
| Repulse (5,40,3): | 0.1300 | |
| ROCnROLL: | 1 | |
| TRIX (15,9): | -0.0100 | |
| Courbe Coppock: | 1.91 |
| MA7: | 144.10 | |
| MA20: | 140.21 | |
| MA50: | 145.28 | |
| MA100: | 154.47 | |
| MAexp7: | 145.85 | |
| MAexp20: | 145.09 | |
| MAexp50: | 144.53 | |
| MAexp100: | 143.30 | |
| Price / MA7: | +2.26% | |
| Price / MA20: | +5.09% | |
| Price / MA50: | +1.42% | |
| Price / MA100: | -4.61% | |
| Price / MAexp7: | +1.03% | |
| Price / MAexp20: | +1.56% | |
| Price / MAexp50: | +1.95% | |
| Price / MAexp100: | +2.83% |
Quotes :
-
15 min delayed data
-
Actions NASDAQ
News
The last news published on MYR GROUP INC. at the time of the generation of this analysis was as follows:
- MYR Group Inc. to Host Earnings Call
- Investor Network: MYR Group Inc. to Host Earnings Call
- Investor Network: MYR Group Inc. to Host Earnings Call
-
 MYR Group
- MYR Group Inc. Announces William A. Koertner Steps Down as President and Chief Executive Officer