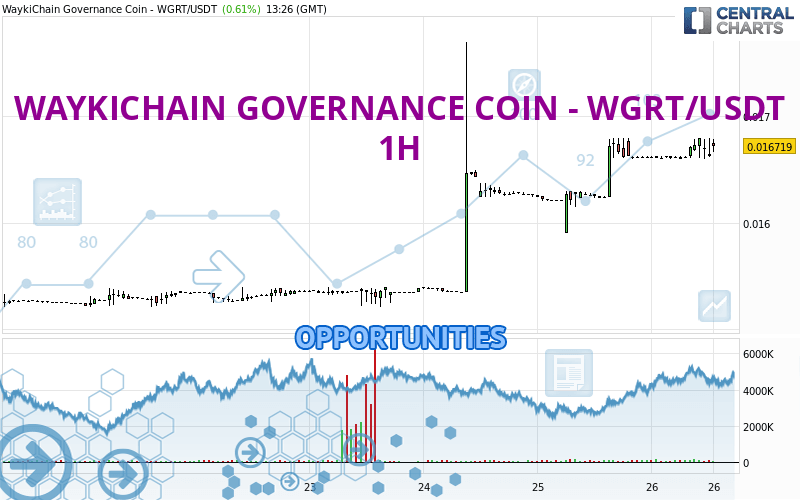
Londinia Opportunities Analyses - 07/26/2024 (GMT) WAYKICHAIN GOVERNANCE COIN - WGRT/USDT - 1H
| Type: | Cryptocurrencies |
| Ticker: | WGRTUSDT |
| ISIN: |
I am pleased to note that the threshold for invalidation has been maintained for 20 Candlesticks.
- Cryptocurrencies
- Timeframe : 1H
- - Analysis generated on
- Status : LEVEL MAINTAINED
Summary of the analysis
Trends
Short term:
Strongly bullish
Underlying:
Strongly bullish
Technical indicators
44%
28%
28%
My opinion
Bullish above 0.016602 USDT
My targets
0.016968 USDT (+1.49%)
0.017698 USDT (+5.86%)
My analysis
All elements being clearly bullish, it would be possible for traders to trade only long positions (at the time of purchase) on WAYKICHAIN GOVERNANCE COIN - WGRT/USDT as long as the price remains well above 0.016602 USDT. The buyers' bullish objective is set at 0.016968 USDT. A bullish break in this resistance would boost the bullish momentum. The buyers could then target the resistance located at 0.017698 USDT. However, beware of bullish excesses that could lead to a possible short-term correction; but this possible correction would not be tradeable.
Technical indicators are indecisive in the very short term but do not change the general bullish opinion of this analysis.
Force
0
10
6.6

Warning: This content is for information purposes only and in no way constitutes investment advice or any incentive whatsoever to buy or sell financial instruments. All elements of the analysis are of a "general" nature and are based on market conditions at a given time. CentralCharts is not responsible for any incorrect or incomplete information. Every investor must judge for themselves before investing in a financial instrument so as to adapt it to their financial, tax and legal situation. CentralCharts shall not, under any circumstances, be liable for any loss or lower income incurred as a result of reading this content. Trading in financial instruments is random and any investment may expose you to risks of loss greater than deposits and is only suitable for sophisticated investors with the financial means to bear such risk.
Additional analysis
Quotes
The WAYKICHAIN GOVERNANCE COIN - WGRT/USDT rating is 0.016719 USDT. On the day, this instrument gained +0.61% with the lowest point at 0.016601 USDT and the highest point at 0.016798 USDT. The deviation from the price is +0.71% for the low point and -0.47% for the high point.0.016601
0.016798
0.016719
So that you have an overall view of the price change, here is a table showing the variations over several periods:
Technical
A technical analysis in 1H of this WAYKICHAIN GOVERNANCE COIN - WGRT/USDT chart shows a strongly bullish trend. 92.86% of the signals given by moving averages are bullish. This strongly bullish trend is supported by the strong bullish signals given by short-term moving averages. The Central Indicators market scanner is currently detecting several bullish signals that could impact this trend:
Bullish price crossover with Moving Average 20
Type : Bullish
Timeframe : 1 hour
Bullish price crossover with adaptative moving average 20
Type : Bullish
Timeframe : 1 hour
Bullish price crossover with adaptative moving average 50
Type : Bullish
Timeframe : 1 hour
In fact, of the 18 technical indicators analysed by Central Analyzer, 8 are bullish, 5 are neutral and 5 are bearish. Central Indicators, the detector scanner for these technical indicators recently detected a signal:
Pivot points : price is over resistance 3
Type : Neutral
Timeframe : Weekly
The analysis of the price chart with Central Patterns scanners does not return any result.
The Central Candlesticks scanner, specialised in Japanese candlesticks, did not identify any signals.
ProTrendLines
S3
S2
S1
R1
R2
Price
| S3 | S2 | S1 | Price | R1 | R2 | |
|---|---|---|---|---|---|---|
| ProTrendLines | 0.015902 | 0.016298 | 0.016602 | 0.016719 | 0.016798 | 0.017698 |
| Change (%) | -4.89% | -2.52% | -0.70% | - | +0.47% | +5.86% |
| Change | -0.000817 | -0.000421 | -0.000117 | - | +0.000079 | +0.000979 |
| Level | Minor | Minor | Minor | - | Minor | Intermediate |
Attention could also be paid to pivot points to set price objectives:
Daily
| Pivot points | S3 | S2 | S1 | PP | R1 | R2 | R3 |
|---|---|---|---|---|---|---|---|
| Standard | 0.015185 | 0.015543 | 0.016081 | 0.016439 | 0.016977 | 0.017335 | 0.017873 |
| Camarilla | 0.016372 | 0.016454 | 0.016536 | 0.016618 | 0.016700 | 0.016782 | 0.016864 |
| Woodie | 0.015274 | 0.015588 | 0.016170 | 0.016484 | 0.017066 | 0.017380 | 0.017962 |
| Fibonacci | 0.015543 | 0.015886 | 0.016097 | 0.016439 | 0.016782 | 0.016993 | 0.017335 |
Weekly
| Pivot points | S3 | S2 | S1 | PP | R1 | R2 | R3 |
|---|---|---|---|---|---|---|---|
| Standard | 0.013804 | 0.014153 | 0.014700 | 0.015049 | 0.015596 | 0.015945 | 0.016492 |
| Camarilla | 0.015001 | 0.015083 | 0.015165 | 0.015247 | 0.015329 | 0.015411 | 0.015493 |
| Woodie | 0.013903 | 0.014203 | 0.014799 | 0.015099 | 0.015695 | 0.015995 | 0.016591 |
| Fibonacci | 0.014153 | 0.014495 | 0.014707 | 0.015049 | 0.015391 | 0.015603 | 0.015945 |
Monthly
| Pivot points | S3 | S2 | S1 | PP | R1 | R2 | R3 |
|---|---|---|---|---|---|---|---|
| Standard | 0.012276 | 0.013106 | 0.013840 | 0.014670 | 0.015404 | 0.016234 | 0.016968 |
| Camarilla | 0.014144 | 0.014287 | 0.014431 | 0.014574 | 0.014717 | 0.014861 | 0.015004 |
| Woodie | 0.012228 | 0.013082 | 0.013792 | 0.014646 | 0.015356 | 0.016210 | 0.016920 |
| Fibonacci | 0.013106 | 0.013703 | 0.014073 | 0.014670 | 0.015267 | 0.015637 | 0.016234 |
Numerical data
The following are the details of the technical indicators and moving averages that were collected to generate this technical analysis:
Technical indicators
Moving averages
| RSI (14): | 61.60 | |
| MACD (12,26,9): | 0.0001 | |
| Directional Movement: | 11.666604 | |
| AROON (14): | 42.857143 | |
| DEMA (21): | 0.016745 | |
| Parabolic SAR (0,02-0,02-0,2): | 0.016553 | |
| Elder Ray (13): | 0.000070 | |
| Super Trend (3,10): | 0.016531 | |
| Zig ZAG (10): | 0.016667 | |
| VORTEX (21): | 0.9903 | |
| Stochastique (14,3,5): | 32.75 | |
| TEMA (21): | 0.016704 | |
| Williams %R (14): | -66.50 | |
| Chande Momentum Oscillator (20): | 0.000057 | |
| Repulse (5,40,3): | -0.8037 | |
| ROCnROLL: | 1 | |
| TRIX (15,9): | 0.0861 | |
| Courbe Coppock: | 0.77 |
| MA7: | 0.015838 | |
| MA20: | 0.015150 | |
| MA50: | 0.014754 | |
| MA100: | 0.014194 | |
| MAexp7: | 0.016675 | |
| MAexp20: | 0.016617 | |
| MAexp50: | 0.016389 | |
| MAexp100: | 0.016075 | |
| Price / MA7: | +5.56% | |
| Price / MA20: | +10.36% | |
| Price / MA50: | +13.32% | |
| Price / MA100: | +17.79% | |
| Price / MAexp7: | +0.26% | |
| Price / MAexp20: | +0.61% | |
| Price / MAexp50: | +2.01% | |
| Price / MAexp100: | +4.01% |
Quotes :
-
Real time data
-
Cryptocompare