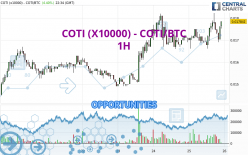
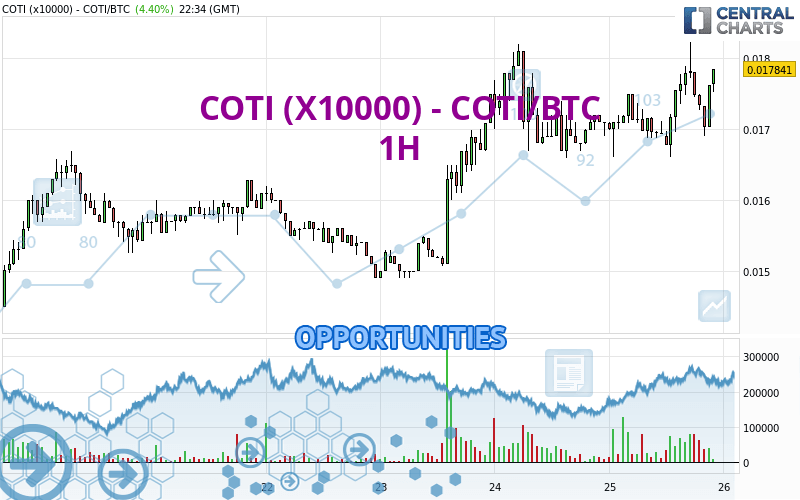
Londinia Opportunities Analyses - 07/25/2024 (GMT) COTI (X10000) - COTI/BTC - 1H
| Type: | Cryptocurrencies |
| Ticker: | COTIBTC |
| ISIN: |
- Cryptocurrencies
- Timeframe : 1H
- - Analysis generated on
- Status : INVALID
Summary of the analysis
Trends
Short term:
Strongly bullish
Underlying:
Strongly bullish
Technical indicators
67%
11%
22%
My opinion
Bullish above 0.017459 BTC
My targets
0.018200 BTC (+2.57%)
0.019887 BTC (+12.08%)
My analysis
The bullish trend is currently very strong on COTI (X10000) - COTI/BTC. As long as the price remains above the support at 0.017459 BTC, you could try to benefit from the boom. The first bullish objective is located at 0.018200 BTC. The bullish momentum would be boosted by a break in this resistance. Buyers would then use the next resistance located at 0.019887 BTC as an objective. Crossing it would then enable buyers to target 0.020935 BTC. Be careful, given the powerful bullish rally underway, excesses could lead to a possible correction in the short term. If this is the case, remember that trading against the trend may be riskier. It would seem more appropriate to wait for a signal indicating reversal of the trend.
Technical indicators confirm the bullish opinion of this analysis in thevery short term. However, be careful of excessive bullish movements. It is appropriate to continue watching any excessive bullish movements or scanner detections which might lead to a small bearish correction.
Force
0
10
7.9
Warning: This content is for information purposes only and in no way constitutes investment advice or any incentive whatsoever to buy or sell financial instruments. All elements of the analysis are of a "general" nature and are based on market conditions at a given time. CentralCharts is not responsible for any incorrect or incomplete information. Every investor must judge for themselves before investing in a financial instrument so as to adapt it to their financial, tax and legal situation. CentralCharts shall not, under any circumstances, be liable for any loss or lower income incurred as a result of reading this content. Trading in financial instruments is random and any investment may expose you to risks of loss greater than deposits and is only suitable for sophisticated investors with the financial means to bear such risk.
Additional analysis
Quotes
COTI (X10000) - COTI/BTC rating 0.017744 BTC. The price registered an increase of +3.83% on the session and was between 0.016601 BTC and 0.018228 BTC. This implies that the price is at +6.89% from its lowest and at -2.66% from its highest.0.016601
0.018228
0.017744
The Central Gaps scanner detects a bearish opening marking the presence of sellers ahead of buyers at the opening but not sufficiently marked to allow the price to register a quotation gap.
Bearish opening
Type : Bearish
Timeframe : Openning
So that you have an overall view of the price change, here is a table showing the variations over several periods:
New HIGH record (1 month)
Type : Bullish
Timeframe : Weekly
Technical
Technical analysis of this 1H chart of COTI (X10000) - COTI/BTC indicates that the overall trend is strongly bullish. 92.86% of the signals given by moving averages are bullish. The overall trend is supported by the strong bullish signals from short-term moving averages. The Central Indicators market scanner currently does not detect any result that concerns moving averages.
The probability of a further increase are moderate given the direction of the technical indicators.
The Central Indicators scanner found this result concerning these indicators:
Pivot points : price is over resistance 1
Type : Neutral
Timeframe : Weekly
An analysis of the price chart with the Central Patterns scanner (detector of chart patterns and resistances and supports) shows a result that can have an impact on the price change:
Resistance of channel is broken
Type : Bullish
Timeframe : 1 hour
The Central Candlesticks scanner which studies Japanese candlesticks did not detect anything.
ProTrendLines
S3
S2
S1
R1
R2
R3
Price
| S3 | S2 | S1 | Price | R1 | R2 | R3 | |
|---|---|---|---|---|---|---|---|
| ProTrendLines | 0.015501 | 0.016688 | 0.017459 | 0.017744 | 0.018200 | 0.020935 | 0.028900 |
| Change (%) | -12.64% | -5.95% | -1.61% | - | +2.57% | +17.98% | +62.87% |
| Change | -0.002243 | -0.001056 | -0.000285 | - | +0.000456 | +0.003191 | +0.011156 |
| Level | Minor | Intermediate | Major | - | Major | Intermediate | Minor |
Attention could also be paid to pivot points to set price objectives:
Daily
| Pivot points | S3 | S2 | S1 | PP | R1 | R2 | R3 |
|---|---|---|---|---|---|---|---|
| Standard | 0.014781 | 0.015687 | 0.016388 | 0.017294 | 0.017995 | 0.018901 | 0.019602 |
| Camarilla | 0.016647 | 0.016794 | 0.016942 | 0.017089 | 0.017236 | 0.017384 | 0.017531 |
| Woodie | 0.014679 | 0.015636 | 0.016286 | 0.017243 | 0.017893 | 0.018850 | 0.019500 |
| Fibonacci | 0.015687 | 0.016301 | 0.016680 | 0.017294 | 0.017908 | 0.018287 | 0.018901 |
Weekly
| Pivot points | S3 | S2 | S1 | PP | R1 | R2 | R3 |
|---|---|---|---|---|---|---|---|
| Standard | 0.011190 | 0.012488 | 0.014089 | 0.015387 | 0.016988 | 0.018286 | 0.019887 |
| Camarilla | 0.014892 | 0.015158 | 0.015423 | 0.015689 | 0.015955 | 0.016221 | 0.016486 |
| Woodie | 0.011341 | 0.012564 | 0.014240 | 0.015463 | 0.017139 | 0.018362 | 0.020038 |
| Fibonacci | 0.012488 | 0.013596 | 0.014280 | 0.015387 | 0.016495 | 0.017179 | 0.018286 |
Monthly
| Pivot points | S3 | S2 | S1 | PP | R1 | R2 | R3 |
|---|---|---|---|---|---|---|---|
| Standard | 0.004051 | 0.008876 | 0.011938 | 0.016763 | 0.019825 | 0.024650 | 0.027712 |
| Camarilla | 0.012831 | 0.013554 | 0.014277 | 0.015000 | 0.015723 | 0.016446 | 0.017169 |
| Woodie | 0.003170 | 0.008435 | 0.011057 | 0.016322 | 0.018944 | 0.024209 | 0.026831 |
| Fibonacci | 0.008876 | 0.011889 | 0.013750 | 0.016763 | 0.019776 | 0.021637 | 0.024650 |
Numerical data
The following are the details of the technical indicators and moving averages that were collected to generate this technical analysis:
Technical indicators
Moving averages
| RSI (14): | 55.22 | |
| MACD (12,26,9): | 0.0001 | |
| Directional Movement: | 7.605317 | |
| AROON (14): | 28.571428 | |
| DEMA (21): | 0.017486 | |
| Parabolic SAR (0,02-0,02-0,2): | 0.018175 | |
| Elder Ray (13): | 0.000245 | |
| Super Trend (3,10): | 0.016891 | |
| Zig ZAG (10): | 0.017532 | |
| VORTEX (21): | 1.1287 | |
| Stochastique (14,3,5): | 48.58 | |
| TEMA (21): | 0.017491 | |
| Williams %R (14): | -42.91 | |
| Chande Momentum Oscillator (20): | 0.000579 | |
| Repulse (5,40,3): | 0.5396 | |
| ROCnROLL: | 1 | |
| TRIX (15,9): | 0.0930 | |
| Courbe Coppock: | 4.58 |
| MA7: | 0.016414 | |
| MA20: | 0.015158 | |
| MA50: | 0.015484 | |
| MA100: | 0.017279 | |
| MAexp7: | 0.017469 | |
| MAexp20: | 0.017316 | |
| MAexp50: | 0.017031 | |
| MAexp100: | 0.016610 | |
| Price / MA7: | +8.10% | |
| Price / MA20: | +17.06% | |
| Price / MA50: | +14.60% | |
| Price / MA100: | +2.69% | |
| Price / MAexp7: | +1.57% | |
| Price / MAexp20: | +2.47% | |
| Price / MAexp50: | +4.19% | |
| Price / MAexp100: | +6.83% |
Quotes :
-
Real time data
-
Cryptocompare