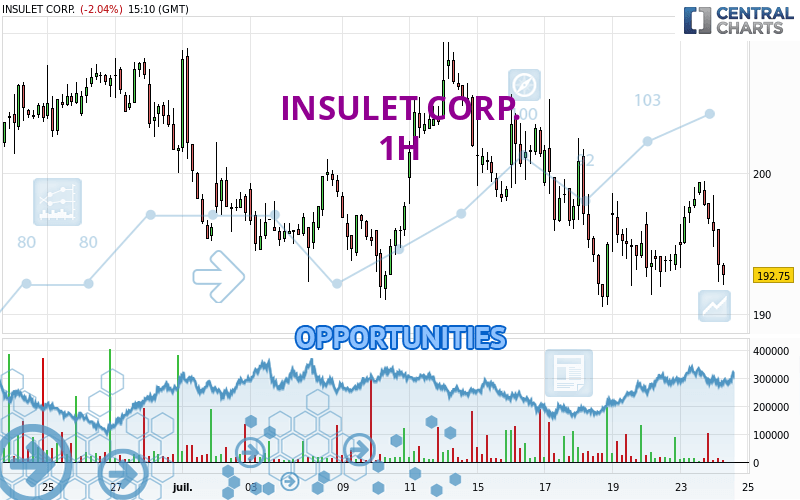
Londinia Opportunities Analyses - 07/24/2024 (GMT) INSULET CORP. - 1H
- U.S. Stocks
- Timeframe : 1H
- - Analysis generated on
- Status : INVALID
Summary of the analysis
Trends
Short term:
Strongly bearish
Underlying:
Strongly bearish
Technical indicators
28%
61%
11%
My opinion
Bearish under 194.92 USD
My targets
190.98 USD (-1.04%)
186.40 USD (-3.41%)
My analysis
All elements being clearly bearish, it would be possible for traders to trade only short positions (for sale) on INSULET CORP. as long as the price remains well below 194.92 USD. The sellers' bearish objective is set at 190.98 USD. A bearish break of this support would revive the bearish momentum. The sellers could then target the support located at 186.40 USD. In case of crossing, the next objective would be the support located at 161.02 USD. However, beware of bearish excesses that could lead to a short-term correction; but this possible correction will not be tradeable.
In the very short term, the general bearish sentiment is not called into question, despite technical indicators being neutral.
Force
0
10
7.1

Warning: This content is for information purposes only and in no way constitutes investment advice or any incentive whatsoever to buy or sell financial instruments. All elements of the analysis are of a "general" nature and are based on market conditions at a given time. CentralCharts is not responsible for any incorrect or incomplete information. Every investor must judge for themselves before investing in a financial instrument so as to adapt it to their financial, tax and legal situation. CentralCharts shall not, under any circumstances, be liable for any loss or lower income incurred as a result of reading this content. Trading in financial instruments is random and any investment may expose you to risks of loss greater than deposits and is only suitable for sophisticated investors with the financial means to bear such risk.
Additional analysis
Quotes
The INSULET CORP. price is 192.98 USD. On the day, this instrument lost -1.92% and was traded between 192.05 USD and 198.44 USD over the period. The price is currently at +0.48% from its lowest and -2.75% from its highest.192.05
198.44
192.98
The Central Gaps scanner detects a bearish opening. A small advantage for sellers in the very short term.
Bearish opening
Type : Bearish
Timeframe : Openning
So that you have an overall view of the price change, here is a table showing the variations over several periods:
Near a new LOW record (1 month)
Type : Bearish
Timeframe : Weekly
Technical
Technical analysis of this 1H chart of INSULET CORP. indicates that the overall trend is strongly bearish. 92.86% of the signals given by moving averages are bearish. This strongly bearish trend is supported by the strong bearish signals given by short-term moving averages. The Central Indicators scanner does not detect any result on moving averages that would impact this trend.
The technical indicators are generally neutral. They do not provide relevant information on the direction of future price movements.
Other results related to technical indicators were also found by the Central Indicators scanner:
Pivot points : price is under support 1
Type : Neutral
Timeframe : 1 hour
Parabolic SAR indicator bearish reversal
Type : Bearish
Timeframe : 1 hour
Williams %R indicator is back under -50
Type : Bearish
Timeframe : 1 hour
An analysis of the price chart with the Central Patterns scanner (detector of chart patterns and resistances and supports) shows a result that can have an impact on the price change:
Near resistance of triangle
Type : Bearish
Timeframe : 1 hour
The Central Candlesticks scanner, specialised in Japanese candlesticks, did not identify any signals.
ProTrendLines
S3
S2
S1
R1
R2
R3
Price
| S3 | S2 | S1 | Price | R1 | R2 | R3 | |
|---|---|---|---|---|---|---|---|
| ProTrendLines | 161.02 | 186.40 | 190.98 | 192.98 | 194.92 | 197.99 | 200.95 |
| Change (%) | -16.56% | -3.41% | -1.04% | - | +1.01% | +2.60% | +4.13% |
| Change | -31.96 | -6.58 | -2.00 | - | +1.94 | +5.01 | +7.97 |
| Level | Intermediate | Major | Intermediate | - | Major | Intermediate | Minor |
Pivot points can also be used to set your price objectives. Here is the price situation in relation to pivot points:
Daily
| Pivot points | S3 | S2 | S1 | PP | R1 | R2 | R3 |
|---|---|---|---|---|---|---|---|
| Standard | 187.25 | 190.24 | 193.50 | 196.49 | 199.75 | 202.74 | 206.00 |
| Camarilla | 195.04 | 195.61 | 196.19 | 196.76 | 197.33 | 197.91 | 198.48 |
| Woodie | 187.39 | 190.31 | 193.64 | 196.56 | 199.89 | 202.81 | 206.14 |
| Fibonacci | 190.24 | 192.63 | 194.10 | 196.49 | 198.88 | 200.35 | 202.74 |
Weekly
| Pivot points | S3 | S2 | S1 | PP | R1 | R2 | R3 |
|---|---|---|---|---|---|---|---|
| Standard | 173.27 | 181.88 | 188.45 | 197.06 | 203.63 | 212.24 | 218.81 |
| Camarilla | 190.86 | 192.25 | 193.64 | 195.03 | 196.42 | 197.81 | 199.21 |
| Woodie | 172.26 | 181.37 | 187.44 | 196.55 | 202.62 | 211.73 | 217.80 |
| Fibonacci | 181.88 | 187.68 | 191.26 | 197.06 | 202.86 | 206.44 | 212.24 |
Monthly
| Pivot points | S3 | S2 | S1 | PP | R1 | R2 | R3 |
|---|---|---|---|---|---|---|---|
| Standard | 143.70 | 157.89 | 179.84 | 194.03 | 215.98 | 230.17 | 252.12 |
| Camarilla | 191.86 | 195.17 | 198.49 | 201.80 | 205.11 | 208.43 | 211.74 |
| Woodie | 147.59 | 159.83 | 183.73 | 195.97 | 219.87 | 232.11 | 256.01 |
| Fibonacci | 157.89 | 171.69 | 180.22 | 194.03 | 207.83 | 216.36 | 230.17 |
Numerical data
The following is the status of technical indicators and moving averages registered at the time this technical analysis was created:
Technical indicators
Moving averages
| RSI (14): | 40.04 | |
| MACD (12,26,9): | -0.3700 | |
| Directional Movement: | -7.83 | |
| AROON (14): | 64.29 | |
| DEMA (21): | 195.03 | |
| Parabolic SAR (0,02-0,02-0,2): | 199.34 | |
| Elder Ray (13): | -2.75 | |
| Super Trend (3,10): | 199.87 | |
| Zig ZAG (10): | 192.24 | |
| VORTEX (21): | 0.9500 | |
| Stochastique (14,3,5): | 28.57 | |
| TEMA (21): | 195.39 | |
| Williams %R (14): | -78.71 | |
| Chande Momentum Oscillator (20): | 0.50 | |
| Repulse (5,40,3): | -2.1000 | |
| ROCnROLL: | 2 | |
| TRIX (15,9): | -0.0200 | |
| Courbe Coppock: | 1.82 |
| MA7: | 196.14 | |
| MA20: | 198.58 | |
| MA50: | 191.80 | |
| MA100: | 181.14 | |
| MAexp7: | 195.22 | |
| MAexp20: | 195.64 | |
| MAexp50: | 196.71 | |
| MAexp100: | 197.57 | |
| Price / MA7: | -1.61% | |
| Price / MA20: | -2.82% | |
| Price / MA50: | +0.62% | |
| Price / MA100: | +6.54% | |
| Price / MAexp7: | -1.15% | |
| Price / MAexp20: | -1.36% | |
| Price / MAexp50: | -1.90% | |
| Price / MAexp100: | -2.32% |
Quotes :
-
15 min delayed data
-
Actions NASDAQ
News
The last news published on INSULET CORP. at the time of the generation of this analysis was as follows:
- Insulet to Announce Fourth Quarter and Full Year 2023 Financial Results on February 22, 2024
- Insulet Reports Second Quarter 2023 Revenue Increase of 32% Year-Over-Year (32% Constant Currency1)
- Insulet to Announce Second Quarter 2023 Financial Results on August 8, 2023
- Insulet Celebrates One Year of Omnipod® 5 at the American Diabetes Association 83rd Scientific Sessions
- Insulet Announces Omnipod® 5 Automated Insulin Delivery System is Now Available in the United Kingdom