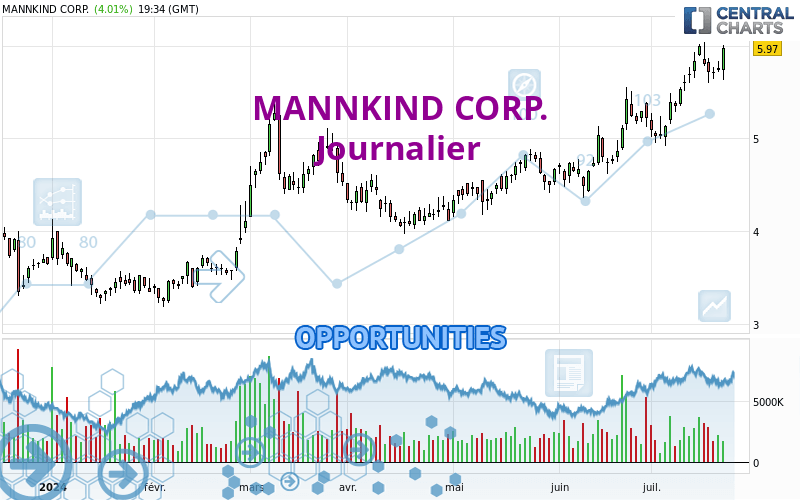
Londinia Opportunities Analyses - 07/23/2024 (GMT) MANNKIND CORP. - Daily
- U.S. Stocks
- Timeframe : Daily
- - Analysis generated on
- Status : INVALID
Summary of the analysis
Trends
Short term:
Strongly bullish
Underlying:
Strongly bullish
Technical indicators
72%
6%
22%
My opinion
Bullish above 5.88 USD
My targets
6.23 USD (+4.41%)
6.92 USD (+15.86%)
My analysis
MANNKIND CORP. is part of a very strong bullish trend. Traders may consider trading only long positions (at the time of purchase) as long as the price remains well above 5.88 USD. The next resistance located at 6.23 USD is the next bullish objective to be reached. A bullish break in this resistance would boost the bullish momentum. The bullish movement could then continue towards the next resistance located at 6.92 USD. After this resistance, buyers could then target 20.05 USD. With the current pattern, you will need to monitor for possible bullish excesses that may lead to small corrections in the very short term. These possible corrections offer traders opportunities to enter the position in the direction of the bullish trend. Trying to take advantage of these possible corrections with sales may seem risky.
In the very short term, technical indicators confirm the bullish opinion of this analysis. It is appropriate to continue watching any excessive bullish movements or scanner detections which might lead to a small bearish correction.
Force
0
10
8.2

Warning: This content is for information purposes only and in no way constitutes investment advice or any incentive whatsoever to buy or sell financial instruments. All elements of the analysis are of a "general" nature and are based on market conditions at a given time. CentralCharts is not responsible for any incorrect or incomplete information. Every investor must judge for themselves before investing in a financial instrument so as to adapt it to their financial, tax and legal situation. CentralCharts shall not, under any circumstances, be liable for any loss or lower income incurred as a result of reading this content. Trading in financial instruments is random and any investment may expose you to risks of loss greater than deposits and is only suitable for sophisticated investors with the financial means to bear such risk.
Additional analysis
Quotes
MANNKIND CORP. rating 5.97 USD. On the day, this instrument gained +4.01% and was between 5.63 USD and 6.01 USD. This implies that the price is at +6.04% from its lowest and at -0.67% from its highest.5.63
6.01
5.97
Here is a more detailed summary of the historical variations registered by MANNKIND CORP.:
Near a new HIGH record (5 years)
Type : Bullish
Timeframe : Weekly
Near a new HIGH record (1 year)
Type : Bullish
Timeframe : Weekly
Near a new HIGH record (1st january)
Type : Bullish
Timeframe : Weekly
Near a new HIGH record (1 month)
Type : Bullish
Timeframe : Weekly
Technical
Technical analysis of this Journalier chart of MANNKIND CORP. indicates that the overall trend is strongly bullish. 92.86% of the signals given by moving averages are bullish. This strongly bullish trend is supported by the strong bullish signals given by short-term moving averages. The Central Indicators market scanner currently does not detect any result that concerns moving averages.
The probability of a further increase is high given the direction of the technical indicators.
Caution: the Central Indicators scanner currently detects an excess:
Williams %R indicator is overbought : over -20
Type : Neutral
Timeframe : Daily
Pivot points : price is over resistance 1
Type : Neutral
Timeframe : Weekly
Pivot points : price is over resistance 3
Type : Neutral
Timeframe : Daily
The Central Patterns scanner, which studies chart patterns, resistances and supports, has identified this signal:
Near horizontal resistance
Type : Bearish
Timeframe : Daily
The Central Candlesticks scanner, specialised in Japanese candlesticks, did not identify any signals.
ProTrendLines
S3
S2
S1
R1
R2
R3
Price
| S3 | S2 | S1 | Price | R1 | R2 | R3 | |
|---|---|---|---|---|---|---|---|
| ProTrendLines | 5.03 | 5.46 | 5.88 | 5.97 | 20.05 | 41.45 | 54.80 |
| Change (%) | -15.75% | -8.54% | -1.51% | - | +235.85% | +594.30% | +817.92% |
| Change | -0.94 | -0.51 | -0.09 | - | +14.08 | +35.48 | +48.83 |
| Level | Major | Major | Major | - | Minor | Minor | Major |
To determine price objectives, it is also possible to use the pivot points. Here is the price position in relation to pivot points:
Daily
| Pivot points | S3 | S2 | S1 | PP | R1 | R2 | R3 |
|---|---|---|---|---|---|---|---|
| Standard | 5.57 | 5.65 | 5.69 | 5.77 | 5.81 | 5.89 | 5.93 |
| Camarilla | 5.71 | 5.72 | 5.73 | 5.74 | 5.75 | 5.76 | 5.77 |
| Woodie | 5.56 | 5.64 | 5.68 | 5.76 | 5.80 | 5.88 | 5.92 |
| Fibonacci | 5.65 | 5.69 | 5.72 | 5.77 | 5.81 | 5.84 | 5.89 |
Weekly
| Pivot points | S3 | S2 | S1 | PP | R1 | R2 | R3 |
|---|---|---|---|---|---|---|---|
| Standard | 5.09 | 5.34 | 5.53 | 5.78 | 5.97 | 6.22 | 6.41 |
| Camarilla | 5.59 | 5.63 | 5.67 | 5.71 | 5.75 | 5.79 | 5.83 |
| Woodie | 5.05 | 5.33 | 5.49 | 5.77 | 5.93 | 6.21 | 6.37 |
| Fibonacci | 5.34 | 5.51 | 5.62 | 5.78 | 5.95 | 6.06 | 6.22 |
Monthly
| Pivot points | S3 | S2 | S1 | PP | R1 | R2 | R3 |
|---|---|---|---|---|---|---|---|
| Standard | 3.35 | 3.85 | 4.54 | 5.04 | 5.73 | 6.23 | 6.92 |
| Camarilla | 4.89 | 5.00 | 5.11 | 5.22 | 5.33 | 5.44 | 5.55 |
| Woodie | 3.44 | 3.90 | 4.63 | 5.09 | 5.82 | 6.28 | 7.01 |
| Fibonacci | 3.85 | 4.31 | 4.59 | 5.04 | 5.50 | 5.78 | 6.23 |
Numerical data
The following are the details of the technical indicators and moving averages that were collected to generate this technical analysis:
Technical indicators
Moving averages
| RSI (14): | 68.56 | |
| MACD (12,26,9): | 0.2600 | |
| Directional Movement: | 23.11 | |
| AROON (14): | 57.14 | |
| DEMA (21): | 5.85 | |
| Parabolic SAR (0,02-0,02-0,2): | 5.52 | |
| Elder Ray (13): | 0.17 | |
| Super Trend (3,10): | 5.30 | |
| Zig ZAG (10): | 5.96 | |
| VORTEX (21): | 1.1400 | |
| Stochastique (14,3,5): | 78.72 | |
| TEMA (21): | 5.93 | |
| Williams %R (14): | -7.14 | |
| Chande Momentum Oscillator (20): | 0.83 | |
| Repulse (5,40,3): | 4.3000 | |
| ROCnROLL: | 1 | |
| TRIX (15,9): | 0.6900 | |
| Courbe Coppock: | 24.46 |
| MA7: | 5.82 | |
| MA20: | 5.48 | |
| MA50: | 5.01 | |
| MA100: | 4.73 | |
| MAexp7: | 5.77 | |
| MAexp20: | 5.51 | |
| MAexp50: | 5.12 | |
| MAexp100: | 4.78 | |
| Price / MA7: | +2.58% | |
| Price / MA20: | +8.94% | |
| Price / MA50: | +19.16% | |
| Price / MA100: | +26.22% | |
| Price / MAexp7: | +3.81% | |
| Price / MAexp20: | +8.71% | |
| Price / MAexp50: | +16.99% | |
| Price / MAexp100: | +25.31% |
Quotes :
-
15 min delayed data
-
Actions NASDAQ
News
Don't forget to follow the news on MANNKIND CORP.. At the time of publication of this analysis, the latest news was as follows:
- MannKind Announces Launch of New Titration Pack and Field Force Expansion to Accelerate Afrezza® Growth
- MannKind Corporation to Hold Investor Conference Call on February 1, 2017
- MannKind Receives $30.6 Million From Sanofi
- CORRECTING AND REPLACING -- MannKind Corporation to Present at the J.P. Morgan 2017 Healthcare Conference
- MannKind Corporation to Present at the J.P. Morgan 2017 Healthcare Conference