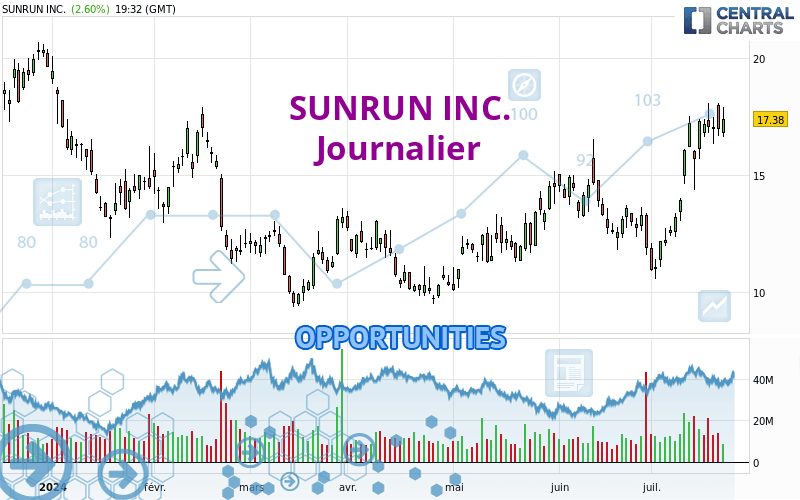
Londinia Opportunities Analyses - 07/23/2024 (GMT) SUNRUN INC. - Daily
- U.S. Stocks
- Timeframe : Daily
- - Analysis generated on
- Status : INVALID
Summary of the analysis
Trends
Short term:
Strongly bullish
Underlying:
Strongly bullish
Technical indicators
78%
0%
22%
My opinion
Bullish above 17.00 USD
My targets
18.29 USD (+5.07%)
20.22 USD (+16.14%)
My analysis
All elements being clearly bullish, it would be possible for traders to trade only long positions (at the time of purchase) on SUNRUN INC. as long as the price remains well above 17.00 USD. The buyers' bullish objective is set at 18.29 USD. A bullish break in this resistance would boost the bullish momentum. The buyers could then target the resistance located at 20.22 USD. If there is any crossing, the next objective would be the resistance located at 39.05 USD. However, beware of bullish excesses that could lead to a possible short-term correction; but this possible correction would not be tradeable.
In the very short term, the general bullish sentiment is confirmed by technical indicators. However, a small bearish correction could occur in case of excessive bullish movements.
Force
0
10
8.6

Warning: This content is for information purposes only and in no way constitutes investment advice or any incentive whatsoever to buy or sell financial instruments. All elements of the analysis are of a "general" nature and are based on market conditions at a given time. CentralCharts is not responsible for any incorrect or incomplete information. Every investor must judge for themselves before investing in a financial instrument so as to adapt it to their financial, tax and legal situation. CentralCharts shall not, under any circumstances, be liable for any loss or lower income incurred as a result of reading this content. Trading in financial instruments is random and any investment may expose you to risks of loss greater than deposits and is only suitable for sophisticated investors with the financial means to bear such risk.
Additional analysis
Quotes
The SUNRUN INC. rating is 17.41 USD. The price has increased by +2.77% since the last closing with the lowest point at 16.63 USD and the highest point at 17.88 USD. The deviation from the price is +4.69% for the low point and -2.63% for the high point.16.63
17.88
17.41
The Central Gaps scanner detects a bearish opening. A small advantage for sellers in the very short term.
Bearish opening
Type : Bearish
Timeframe : Openning
Here is a more detailed summary of the historical variations registered by SUNRUN INC.:
Near a new HIGH record (1 month)
Type : Bullish
Timeframe : Weekly
Technical
Technical analysis of this Journalier chart of SUNRUN INC. indicates that the overall trend is strongly bullish. The signals given by the moving averages are 92.86% bullish. This strong bullish trend is confirmed by the strong signals currently being given by short-term moving averages. There is no crossing of moving average by the price or crossing of moving averages between themselves.
The probability of a further increase is high given the direction of the technical indicators.
But beware of excesses. The Central Indicators scanner currently detects this:
Williams %R indicator is overbought : over -20
Type : Neutral
Timeframe : Daily
Price is back over the pivot point
Type : Bullish
Timeframe : Daily
The analysis of the price chart with Central Patterns scanners does not return any result.
The Central Candlesticks scanner, specialised in Japanese candlesticks, did not identify any signals.
ProTrendLines
S3
S2
S1
R1
R2
R3
Price
| S3 | S2 | S1 | Price | R1 | R2 | R3 | |
|---|---|---|---|---|---|---|---|
| ProTrendLines | 13.18 | 14.92 | 17.00 | 17.41 | 20.22 | 39.05 | 58.66 |
| Change (%) | -24.30% | -14.30% | -2.35% | - | +16.14% | +124.30% | +236.93% |
| Change | -4.23 | -2.49 | -0.41 | - | +2.81 | +21.64 | +41.25 |
| Level | Major | Intermediate | Minor | - | Major | Intermediate | Intermediate |
To determine price objectives, it is also possible to use the pivot points. Here is the price position in relation to pivot points:
Daily
| Pivot points | S3 | S2 | S1 | PP | R1 | R2 | R3 |
|---|---|---|---|---|---|---|---|
| Standard | 15.01 | 15.84 | 16.39 | 17.22 | 17.77 | 18.60 | 19.15 |
| Camarilla | 16.56 | 16.69 | 16.81 | 16.94 | 17.07 | 17.19 | 17.32 |
| Woodie | 14.87 | 15.77 | 16.25 | 17.15 | 17.63 | 18.53 | 19.01 |
| Fibonacci | 15.84 | 16.37 | 16.69 | 17.22 | 17.75 | 18.07 | 18.60 |
Weekly
| Pivot points | S3 | S2 | S1 | PP | R1 | R2 | R3 |
|---|---|---|---|---|---|---|---|
| Standard | 11.14 | 12.75 | 14.85 | 16.46 | 18.56 | 20.17 | 22.27 |
| Camarilla | 15.93 | 16.27 | 16.61 | 16.95 | 17.29 | 17.63 | 17.97 |
| Woodie | 11.39 | 12.87 | 15.10 | 16.58 | 18.81 | 20.29 | 22.52 |
| Fibonacci | 12.75 | 14.17 | 15.04 | 16.46 | 17.88 | 18.75 | 20.17 |
Monthly
| Pivot points | S3 | S2 | S1 | PP | R1 | R2 | R3 |
|---|---|---|---|---|---|---|---|
| Standard | 5.12 | 8.33 | 10.10 | 13.31 | 15.08 | 18.29 | 20.06 |
| Camarilla | 10.49 | 10.95 | 11.40 | 11.86 | 12.32 | 12.77 | 13.23 |
| Woodie | 4.39 | 7.97 | 9.37 | 12.95 | 14.35 | 17.93 | 19.33 |
| Fibonacci | 8.33 | 10.24 | 11.41 | 13.31 | 15.22 | 16.39 | 18.29 |
Numerical data
The following is the status of the technical indicators and moving averages at the time of publication of this technical analysis:
Technical indicators
Moving averages
| RSI (14): | 65.60 | |
| MACD (12,26,9): | 1.1700 | |
| Directional Movement: | 17.78 | |
| AROON (14): | 78.57 | |
| DEMA (21): | 16.60 | |
| Parabolic SAR (0,02-0,02-0,2): | 14.30 | |
| Elder Ray (13): | 1.36 | |
| Super Trend (3,10): | 13.51 | |
| Zig ZAG (10): | 17.35 | |
| VORTEX (21): | 1.0800 | |
| Stochastique (14,3,5): | 86.85 | |
| TEMA (21): | 17.38 | |
| Williams %R (14): | -9.67 | |
| Chande Momentum Oscillator (20): | 5.16 | |
| Repulse (5,40,3): | 0.3200 | |
| ROCnROLL: | 1 | |
| TRIX (15,9): | 0.8500 | |
| Courbe Coppock: | 81.19 |
| MA7: | 16.93 | |
| MA20: | 14.42 | |
| MA50: | 13.67 | |
| MA100: | 12.50 | |
| MAexp7: | 16.74 | |
| MAexp20: | 15.24 | |
| MAexp50: | 13.97 | |
| MAexp100: | 13.46 | |
| Price / MA7: | +2.84% | |
| Price / MA20: | +20.74% | |
| Price / MA50: | +27.36% | |
| Price / MA100: | +39.28% | |
| Price / MAexp7: | +4.00% | |
| Price / MAexp20: | +14.24% | |
| Price / MAexp50: | +24.62% | |
| Price / MAexp100: | +29.35% |
Quotes :
-
15 min delayed data
-
Actions NASDAQ
News
Don't forget to follow the news on SUNRUN INC.. At the time of publication of this analysis, the latest news was as follows:
- Roivant Sciences Set to Join S&P MidCap 400; Sunrun to Join S&P SmallCap 600
- Sunrun and PG&E Complete First Season of Innovative Residential Distributed Power Plant
- SHAREHOLDER ALERT: Pomerantz Law Firm Investigates Claims On Behalf of Investors of Sunrun Inc. - RUN
- SHAREHOLDER ALERT: Pomerantz Law Firm Investigates Claims On Behalf of Investors of Sunrun Inc. - RUN
- SHAREHOLDER ALERT: Pomerantz Law Firm Investigates Claims On Behalf of Investors of Sunrun Inc. - RUN