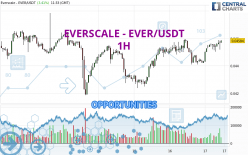
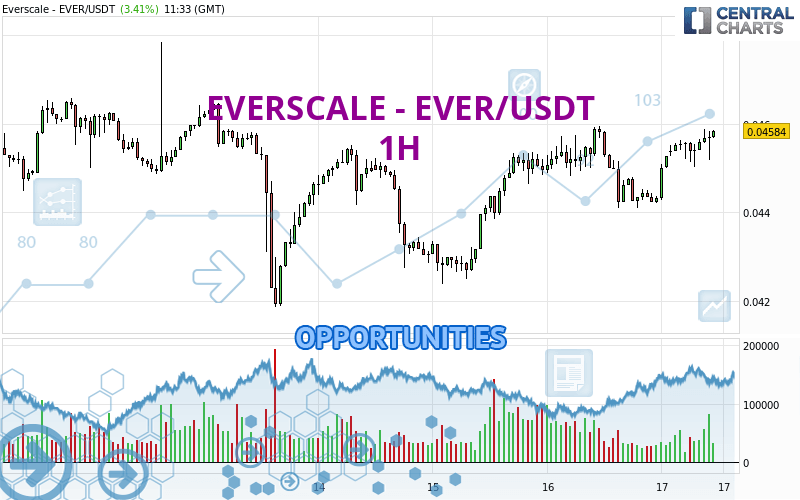
Londinia Opportunities Analyses - 05/17/2024 (GMT) EVERSCALE - EVER/USDT - 1H
| Type: | Cryptocurrencies |
| Ticker: | EVERUSDT |
| ISIN: |
I am delighted to see that my first price objective has been achieved. I hope you've taken advantage of it.
- Cryptocurrencies
- Timeframe : 1H
- - Analysis generated on
- Status : TARGET REACHED
Summary of the analysis
Trends
Short term:
Strongly bullish
Underlying:
Strongly bullish
Technical indicators
83%
0%
17%
My opinion
Bullish above 0.044842 USDT
My targets
0.046785 USDT (+2.25%)
0.047844 USDT (+4.57%)
My analysis
The bullish trend is currently very strong on EVERSCALE - EVER/USDT. As long as the price remains above the support at 0.044842 USDT, you could try to benefit from the boom. The first bullish objective is located at 0.046785 USDT. The bullish momentum would be boosted by a break in this resistance. Buyers would then use the next resistance located at 0.047844 USDT as an objective. Crossing it would then enable buyers to target 0.048434 USDT. Be careful, given the powerful bullish rally underway, excesses could lead to a possible correction in the short term. If this is the case, remember that trading against the trend may be riskier. It would seem more appropriate to wait for a signal indicating reversal of the trend.
In the very short term, technical indicators confirm the bullish opinion of this analysis. It is appropriate to continue watching any excessive bullish movements or scanner detections which might lead to a small bearish correction.
Force
0
10
8.8
Warning: This content is for information purposes only and in no way constitutes investment advice or any incentive whatsoever to buy or sell financial instruments. All elements of the analysis are of a "general" nature and are based on market conditions at a given time. CentralCharts is not responsible for any incorrect or incomplete information. Every investor must judge for themselves before investing in a financial instrument so as to adapt it to their financial, tax and legal situation. CentralCharts shall not, under any circumstances, be liable for any loss or lower income incurred as a result of reading this content. Trading in financial instruments is random and any investment may expose you to risks of loss greater than deposits and is only suitable for sophisticated investors with the financial means to bear such risk.
Additional analysis
Quotes
The EVERSCALE - EVER/USDT price is 0.045754 USDT. The price has increased by +3.22% since the last closing with the lowest point at 0.044280 USDT and the highest point at 0.045868 USDT. The deviation from the price is +3.33% for the low point and -0.25% for the high point.0.044280
0.045868
0.045754
So that you have an overall view of the price change, here is a table showing the variations over several periods:
Technical
Technical analysis of this 1H chart of EVERSCALE - EVER/USDT indicates that the overall trend is strongly bullish. 92.86% of the signals given by moving averages are bullish. The overall trend is supported by the strong bullish signals from short-term moving averages. The Central Indicators market scanner is currently detecting a bullish signal that could impact this trend:
Bullish trend reversal : Moving Average 100
Type : Bullish
Timeframe : 1 hour
In fact, 15 technical indicators on 18 studied are currently positioned bullish. Caution: the Central Indicators scanner currently detects an excess:
Williams %R indicator is overbought : over -20
Type : Neutral
Timeframe : 1 hour
Pivot points : price is over resistance 1
Type : Neutral
Timeframe : 1 hour
The Central Patterns scanner, which studies chart patterns, resistances and supports, has identified this signal:
Near resistance of triangle
Type : Bearish
Timeframe : 1 hour
The presence of a bearish pattern in Japanese candlesticks detected by Central Candlesticks that could cause a correction in the very short term was also detected:
Bearish doji star
Type : Bearish
Timeframe : 1 hour
ProTrendLines
S3
S2
S1
R1
R2
R3
Price
| S3 | S2 | S1 | Price | R1 | R2 | R3 | |
|---|---|---|---|---|---|---|---|
| ProTrendLines | 0.042380 | 0.044105 | 0.044842 | 0.045754 | 0.045944 | 0.046785 | 0.047844 |
| Change (%) | -7.37% | -3.60% | -1.99% | - | +0.42% | +2.25% | +4.57% |
| Change | -0.003374 | -0.001649 | -0.000912 | - | +0.000190 | +0.001031 | +0.002090 |
| Level | Intermediate | Minor | Intermediate | - | Minor | Minor | Minor |
To determine price objectives, it is also possible to use the pivot points. Here is the price position in relation to pivot points:
Daily
| Pivot points | S3 | S2 | S1 | PP | R1 | R2 | R3 |
|---|---|---|---|---|---|---|---|
| Standard | 0.041769 | 0.042928 | 0.043627 | 0.044786 | 0.045485 | 0.046644 | 0.047343 |
| Camarilla | 0.043816 | 0.043986 | 0.044157 | 0.044327 | 0.044497 | 0.044668 | 0.044838 |
| Woodie | 0.041540 | 0.042813 | 0.043398 | 0.044671 | 0.045256 | 0.046529 | 0.047114 |
| Fibonacci | 0.042928 | 0.043637 | 0.044076 | 0.044786 | 0.045495 | 0.045934 | 0.046644 |
Weekly
| Pivot points | S3 | S2 | S1 | PP | R1 | R2 | R3 |
|---|---|---|---|---|---|---|---|
| Standard | 0.035428 | 0.037844 | 0.041953 | 0.044369 | 0.048478 | 0.050894 | 0.055003 |
| Camarilla | 0.044268 | 0.044866 | 0.045464 | 0.046062 | 0.046660 | 0.047258 | 0.047856 |
| Woodie | 0.036275 | 0.038267 | 0.042800 | 0.044792 | 0.049325 | 0.051317 | 0.055850 |
| Fibonacci | 0.037844 | 0.040337 | 0.041877 | 0.044369 | 0.046862 | 0.048402 | 0.050894 |
Monthly
| Pivot points | S3 | S2 | S1 | PP | R1 | R2 | R3 |
|---|---|---|---|---|---|---|---|
| Standard | 0.010930 | 0.021733 | 0.027470 | 0.038273 | 0.044010 | 0.054813 | 0.060550 |
| Camarilla | 0.028659 | 0.030175 | 0.031691 | 0.033207 | 0.034723 | 0.036239 | 0.037756 |
| Woodie | 0.008397 | 0.020467 | 0.024937 | 0.037007 | 0.041477 | 0.053547 | 0.058017 |
| Fibonacci | 0.021733 | 0.028051 | 0.031955 | 0.038273 | 0.044591 | 0.048495 | 0.054813 |
Numerical data
The following are the details of the technical indicators and moving averages that were collected to generate this technical analysis:
Technical indicators
Moving averages
| RSI (14): | 64.50 | |
| MACD (12,26,9): | 0.0002 | |
| Directional Movement: | -1.246800 | |
| AROON (14): | 71.428572 | |
| DEMA (21): | 0.045563 | |
| Parabolic SAR (0,02-0,02-0,2): | 0.045145 | |
| Elder Ray (13): | 0.000345 | |
| Super Trend (3,10): | 0.044659 | |
| Zig ZAG (10): | 0.045785 | |
| VORTEX (21): | 1.0909 | |
| Stochastique (14,3,5): | 90.95 | |
| TEMA (21): | 0.045681 | |
| Williams %R (14): | -4.58 | |
| Chande Momentum Oscillator (20): | 0.001456 | |
| Repulse (5,40,3): | 0.8990 | |
| ROCnROLL: | 1 | |
| TRIX (15,9): | 0.0484 | |
| Courbe Coppock: | 5.07 |
| MA7: | 0.044992 | |
| MA20: | 0.041477 | |
| MA50: | 0.039100 | |
| MA100: | 0.042773 | |
| MAexp7: | 0.045580 | |
| MAexp20: | 0.045282 | |
| MAexp50: | 0.044975 | |
| MAexp100: | 0.044821 | |
| Price / MA7: | +1.69% | |
| Price / MA20: | +10.31% | |
| Price / MA50: | +17.02% | |
| Price / MA100: | +6.97% | |
| Price / MAexp7: | +0.38% | |
| Price / MAexp20: | +1.04% | |
| Price / MAexp50: | +1.73% | |
| Price / MAexp100: | +2.08% |
Quotes :
-
Real time data
-
Cryptocompare