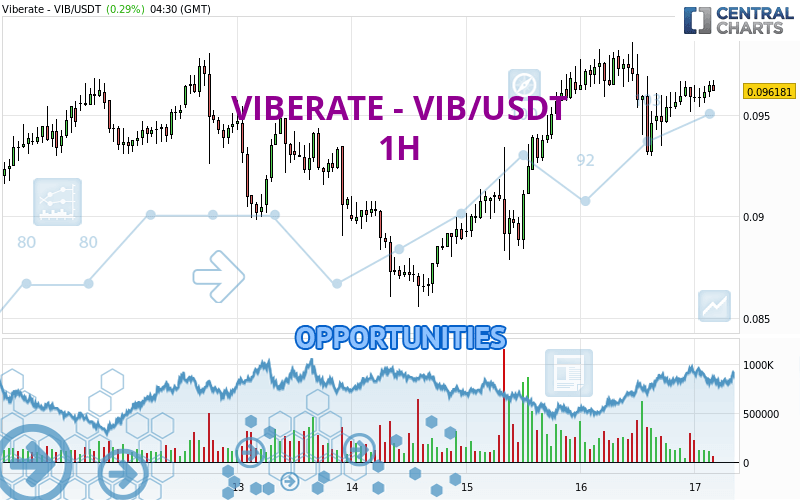
Londinia Opportunities Analyses - 05/17/2024 (GMT) VIBERATE - VIB/USDT - 1H
| Type: | Cryptocurrencies |
| Ticker: | VIBUSDT |
| ISIN: |
I am delighted to see that my first price objective has been achieved. I hope you've taken advantage of it.
- Cryptocurrencies
- Timeframe : 1H
- - Analysis generated on
- Status : TARGET REACHED
Summary of the analysis
Trends
Short term:
Bullish
Underlying:
Strongly bullish
Technical indicators
78%
6%
17%
My opinion
Bullish above 0.095168 USDT
My targets
0.098602 USDT (+2.36%)
0.100960 USDT (+4.81%)
My analysis
The basic bullish trend is very strong on VIBERATE - VIB/USDT but the short term shows some signs of running out of steam. However, a purchase could be considered as long as the price remains above 0.095168 USDT. Crossing the first resistance at 0.098602 USDT would be a sign of a potential new surge in the price. Buyers would then use the next resistance located at 0.100960 USDT as an objective. Crossing it would then enable buyers to target 0.109955 USDT. Caution, a return to below 0.095168 USDT would be a sign of a consolidation phase in the short-term basic trend. If this is the case, remember that trading against the trend may be riskier. It would seem more appropriate to wait for a signal indicating reversal of the trend.
In the very short term, the general bullish sentiment is confirmed by technical indicators. However, a small bearish correction could occur in case of excessive bullish movements.
Force
0
10
7.7

Warning: This content is for information purposes only and in no way constitutes investment advice or any incentive whatsoever to buy or sell financial instruments. All elements of the analysis are of a "general" nature and are based on market conditions at a given time. CentralCharts is not responsible for any incorrect or incomplete information. Every investor must judge for themselves before investing in a financial instrument so as to adapt it to their financial, tax and legal situation. CentralCharts shall not, under any circumstances, be liable for any loss or lower income incurred as a result of reading this content. Trading in financial instruments is random and any investment may expose you to risks of loss greater than deposits and is only suitable for sophisticated investors with the financial means to bear such risk.
Additional analysis
Quotes
The VIBERATE - VIB/USDT rating is 0.096329 USDT. On the day, this instrument gained +0.45% and was between 0.095371 USDT and 0.096709 USDT. This implies that the price is at +1.00% from its lowest and at -0.39% from its highest.0.095371
0.096709
0.096329
The Central Gaps scanner detects a bearish opening. A small advantage for sellers in the very short term.
Bearish opening
Type : Bearish
Timeframe : Openning
Here is a more detailed summary of the historical variations registered by VIBERATE - VIB/USDT:
Technical
Technical analysis of this 1H chart of VIBERATE - VIB/USDT indicates that the overall trend is strongly bullish. The signals given by moving averages are 89.29% bullish. This strongly bullish trend seems to be running out of steam given the signals being given by short-term moving averages. The Central Indicators scanner does not detect any result on moving averages that would impact this trend.
An assessment of technical indicators shows a strong bullish signal.
Caution: the Central Indicators scanner currently detects an excess:
Williams %R indicator is overbought : over -20
Type : Neutral
Timeframe : 1 hour
MACD crosses UP its Moving Average
Type : Bullish
Timeframe : 1 hour
Price is back over the pivot point
Type : Bullish
Timeframe : Weekly
An analysis of the price chart with the Central Patterns scanner (detector of chart patterns and resistances and supports) shows a result that can have an impact on the price change:
Near resistance of triangle
Type : Bearish
Timeframe : 1 hour
The Central Candlesticks scanner which studies Japanese candlesticks did not detect anything.
ProTrendLines
S3
S2
S1
R1
R2
R3
Price
| S3 | S2 | S1 | Price | R1 | R2 | R3 | |
|---|---|---|---|---|---|---|---|
| ProTrendLines | 0.087807 | 0.093006 | 0.095168 | 0.096329 | 0.096800 | 0.098602 | 0.100960 |
| Change (%) | -8.85% | -3.45% | -1.21% | - | +0.49% | +2.36% | +4.81% |
| Change | -0.008522 | -0.003323 | -0.001161 | - | +0.000471 | +0.002273 | +0.004631 |
| Level | Major | Major | Minor | - | Minor | Intermediate | Intermediate |
To determine price objectives, it is also possible to use the pivot points. Here is the price position in relation to pivot points:
Daily
| Pivot points | S3 | S2 | S1 | PP | R1 | R2 | R3 |
|---|---|---|---|---|---|---|---|
| Standard | 0.087455 | 0.090224 | 0.093062 | 0.095831 | 0.098669 | 0.101438 | 0.104276 |
| Camarilla | 0.094357 | 0.094871 | 0.095385 | 0.095899 | 0.096413 | 0.096927 | 0.097441 |
| Woodie | 0.087489 | 0.090241 | 0.093096 | 0.095848 | 0.098703 | 0.101455 | 0.104310 |
| Fibonacci | 0.090224 | 0.092366 | 0.093690 | 0.095831 | 0.097973 | 0.099297 | 0.101438 |
Weekly
| Pivot points | S3 | S2 | S1 | PP | R1 | R2 | R3 |
|---|---|---|---|---|---|---|---|
| Standard | 0.076087 | 0.083595 | 0.088546 | 0.096054 | 0.101005 | 0.108513 | 0.113464 |
| Camarilla | 0.090071 | 0.091213 | 0.092355 | 0.093497 | 0.094639 | 0.095781 | 0.096923 |
| Woodie | 0.074809 | 0.082956 | 0.087268 | 0.095415 | 0.099727 | 0.107874 | 0.112186 |
| Fibonacci | 0.083595 | 0.088354 | 0.091295 | 0.096054 | 0.100813 | 0.103754 | 0.108513 |
Monthly
| Pivot points | S3 | S2 | S1 | PP | R1 | R2 | R3 |
|---|---|---|---|---|---|---|---|
| Standard | -0.026397 | 0.022887 | 0.057535 | 0.106819 | 0.141467 | 0.190751 | 0.225399 |
| Camarilla | 0.069102 | 0.076796 | 0.084489 | 0.092183 | 0.099877 | 0.107571 | 0.115264 |
| Woodie | -0.033715 | 0.019228 | 0.050217 | 0.103160 | 0.134149 | 0.187092 | 0.218081 |
| Fibonacci | 0.022887 | 0.054949 | 0.074757 | 0.106819 | 0.138881 | 0.158689 | 0.190751 |
Numerical data
The following is the status of technical indicators and moving averages registered at the time this technical analysis was created:
Technical indicators
Moving averages
| RSI (14): | 55.59 | |
| MACD (12,26,9): | 0.0003 | |
| Directional Movement: | -0.970894 | |
| AROON (14): | -7.142857 | |
| DEMA (21): | 0.096322 | |
| Parabolic SAR (0,02-0,02-0,2): | 0.093854 | |
| Elder Ray (13): | 0.000464 | |
| Super Trend (3,10): | 0.099733 | |
| Zig ZAG (10): | 0.096320 | |
| VORTEX (21): | 0.9903 | |
| Stochastique (14,3,5): | 85.92 | |
| TEMA (21): | 0.095939 | |
| Williams %R (14): | -10.42 | |
| Chande Momentum Oscillator (20): | 0.001395 | |
| Repulse (5,40,3): | 0.2113 | |
| ROCnROLL: | 1 | |
| TRIX (15,9): | 0.0424 | |
| Courbe Coppock: | 1.09 |
| MA7: | 0.093757 | |
| MA20: | 0.095286 | |
| MA50: | 0.103955 | |
| MA100: | 0.095357 | |
| MAexp7: | 0.096126 | |
| MAexp20: | 0.095857 | |
| MAexp50: | 0.094820 | |
| MAexp100: | 0.093982 | |
| Price / MA7: | +2.74% | |
| Price / MA20: | +1.09% | |
| Price / MA50: | -7.34% | |
| Price / MA100: | +1.02% | |
| Price / MAexp7: | +0.21% | |
| Price / MAexp20: | +0.49% | |
| Price / MAexp50: | +1.59% | |
| Price / MAexp100: | +2.50% |
Quotes :
-
Real time data
-
Cryptocompare