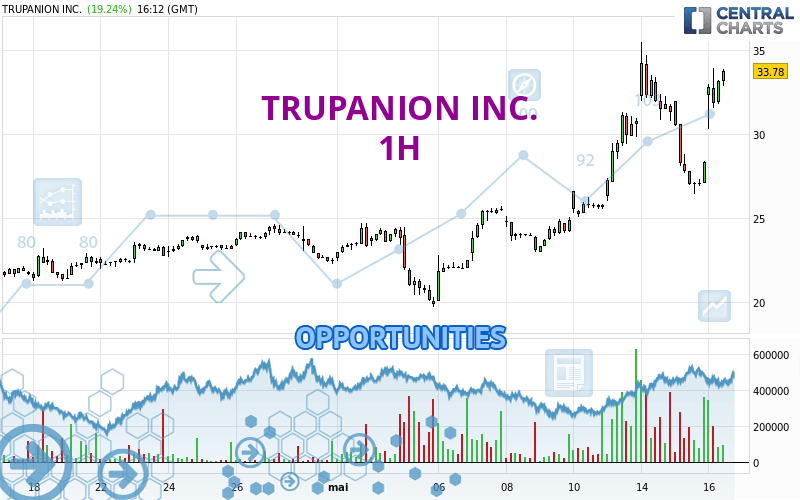
Londinia Opportunities Analyses - 05/16/2024 (GMT) TRUPANION INC. - 1H
- U.S. Stocks
- Timeframe : 1H
- - Analysis generated on
- Status : INVALID
Summary of the analysis
Trends
Short term:
Strongly bullish
Underlying:
Strongly bullish
Technical indicators
78%
6%
17%
My opinion
Bullish above 31.29 USD
My targets
34.78 USD (+5.43%)
35.18 USD (+6.64%)
My analysis
All elements being clearly bullish, it would be possible for traders to trade only long positions (at the time of purchase) on TRUPANION INC. as long as the price remains well above 31.29 USD. The buyers' bullish objective is set at 34.78 USD. A bullish break in this resistance would boost the bullish momentum. The buyers could then target the resistance located at 35.18 USD. If there is any crossing, the next objective would be the resistance located at 67.82 USD. However, beware of bullish excesses that could lead to a possible short-term correction; but this possible correction would not be tradeable.
Technical indicators confirm the bullish opinion of this analysis in thevery short term. However, be careful of excessive bullish movements. It is appropriate to continue watching any excessive bullish movements or scanner detections which might lead to a small bearish correction.
Force
0
10
8.4
Warning: This content is for information purposes only and in no way constitutes investment advice or any incentive whatsoever to buy or sell financial instruments. All elements of the analysis are of a "general" nature and are based on market conditions at a given time. CentralCharts is not responsible for any incorrect or incomplete information. Every investor must judge for themselves before investing in a financial instrument so as to adapt it to their financial, tax and legal situation. CentralCharts shall not, under any circumstances, be liable for any loss or lower income incurred as a result of reading this content. Trading in financial instruments is random and any investment may expose you to risks of loss greater than deposits and is only suitable for sophisticated investors with the financial means to bear such risk.
Additional analysis
Quotes
TRUPANION INC. rating 32.99 USD. The price has increased by +16.45% since the last closing with the lowest point at 30.28 USD and the highest point at 33.93 USD. The deviation from the price is +8.95% for the low point and -2.77% for the high point.30.28
33.93
32.99
The Central Gaps scanner detects a bullish gap which is a sign that buyers have taken the lead in the very short term.
Opening Gap UP
Type : Bullish
Timeframe : Openning
A study of price movements over other periods shows the following variations:
Near a new HIGH record (1 month)
Type : Bullish
Timeframe : Weekly
Abnormal volumes on TRUPANION INC. were detected by the Central Volumes scanner:
Abnormal volumes
Timeframe : 5 days
Technical
Technical analysis of TRUPANION INC. in 1H shows a strongly overall bullish trend. 92.86% of the signals given by moving averages are bullish. This strongly bullish trend is supported by the strong bullish signals given by short-term moving averages. There is no crossing of moving average by the price or crossing of moving averages between themselves.
The probability of a further increase is high given the direction of the technical indicators.
Caution: the Central Indicators scanner currently detects an excess:
Williams %R indicator is overbought : over -20
Type : Neutral
Timeframe : 1 hour
Pivot points : price is over resistance 1
Type : Neutral
Timeframe : 1 hour
Pivot points : price is over resistance 2
Type : Neutral
Timeframe : Weekly
MACD crosses UP its Moving Average
Type : Bullish
Timeframe : 1 hour
Aroon indicator bullish trend
Type : Bullish
Timeframe : 1 hour
Momentum indicator is back over 0
Type : Bullish
Timeframe : 1 hour
No signals are given by Central Patterns, a market scanner specialised in chart patterns, resistances and supports.
The Central Candlesticks scanner, specialised in Japanese candlesticks, did not identify any signals.
ProTrendLines
S3
S2
S1
R1
R2
R3
Price
| S3 | S2 | S1 | Price | R1 | R2 | R3 | |
|---|---|---|---|---|---|---|---|
| ProTrendLines | 27.80 | 29.50 | 31.29 | 32.99 | 33.12 | 35.18 | 67.82 |
| Change (%) | -15.73% | -10.58% | -5.15% | - | +0.39% | +6.64% | +105.58% |
| Change | -5.19 | -3.49 | -1.70 | - | +0.13 | +2.19 | +34.83 |
| Level | Intermediate | Minor | Minor | - | Minor | Major | Intermediate |
Attention could also be paid to pivot points to set price objectives:
Daily
| Pivot points | S3 | S2 | S1 | PP | R1 | R2 | R3 |
|---|---|---|---|---|---|---|---|
| Standard | 20.28 | 23.34 | 25.84 | 28.90 | 31.40 | 34.46 | 36.96 |
| Camarilla | 26.80 | 27.31 | 27.82 | 28.33 | 28.84 | 29.35 | 29.86 |
| Woodie | 19.99 | 23.20 | 25.55 | 28.76 | 31.11 | 34.32 | 36.67 |
| Fibonacci | 23.34 | 25.47 | 26.78 | 28.90 | 31.03 | 32.34 | 34.46 |
Weekly
| Pivot points | S3 | S2 | S1 | PP | R1 | R2 | R3 |
|---|---|---|---|---|---|---|---|
| Standard | 15.16 | 17.61 | 21.70 | 24.15 | 28.24 | 30.69 | 34.78 |
| Camarilla | 24.00 | 24.60 | 25.20 | 25.80 | 26.40 | 27.00 | 27.60 |
| Woodie | 15.99 | 18.02 | 22.53 | 24.56 | 29.07 | 31.10 | 35.61 |
| Fibonacci | 17.61 | 20.11 | 21.65 | 24.15 | 26.65 | 28.19 | 30.69 |
Monthly
| Pivot points | S3 | S2 | S1 | PP | R1 | R2 | R3 |
|---|---|---|---|---|---|---|---|
| Standard | 12.65 | 16.91 | 19.71 | 23.97 | 26.77 | 31.03 | 33.83 |
| Camarilla | 20.56 | 21.21 | 21.85 | 22.50 | 23.15 | 23.79 | 24.44 |
| Woodie | 11.91 | 16.55 | 18.97 | 23.61 | 26.03 | 30.67 | 33.09 |
| Fibonacci | 16.91 | 19.61 | 21.28 | 23.97 | 26.67 | 28.34 | 31.03 |
Numerical data
The following is the status of technical indicators and moving averages registered at the time this technical analysis was created:
Technical indicators
Moving averages
| RSI (14): | 62.60 | |
| MACD (12,26,9): | 0.8500 | |
| Directional Movement: | 24.26 | |
| AROON (14): | 28.57 | |
| DEMA (21): | 30.98 | |
| Parabolic SAR (0,02-0,02-0,2): | 26.84 | |
| Elder Ray (13): | 2.20 | |
| Super Trend (3,10): | 27.68 | |
| Zig ZAG (10): | 32.51 | |
| VORTEX (21): | 1.0000 | |
| Stochastique (14,3,5): | 78.62 | |
| TEMA (21): | 30.83 | |
| Williams %R (14): | -13.43 | |
| Chande Momentum Oscillator (20): | 1.41 | |
| Repulse (5,40,3): | 3.8300 | |
| ROCnROLL: | 1 | |
| TRIX (15,9): | 0.4500 | |
| Courbe Coppock: | 11.09 |
| MA7: | 28.20 | |
| MA20: | 24.87 | |
| MA50: | 25.58 | |
| MA100: | 26.97 | |
| MAexp7: | 31.42 | |
| MAexp20: | 29.79 | |
| MAexp50: | 27.94 | |
| MAexp100: | 26.33 | |
| Price / MA7: | +16.99% | |
| Price / MA20: | +32.65% | |
| Price / MA50: | +28.97% | |
| Price / MA100: | +22.32% | |
| Price / MAexp7: | +5.00% | |
| Price / MAexp20: | +10.74% | |
| Price / MAexp50: | +18.07% | |
| Price / MAexp100: | +25.29% |
Quotes :
-
15 min delayed data
-
Actions NASDAQ
News
The latest news and videos published on TRUPANION INC. at the time of the analysis were as follows:
- Trupanion Reports First Quarter 2024 Results
- Trupanion’s Margi Tooth Appointed Chief Executive Officer Effective August 1, 2024
- Trupanion, Inc. Announces First Quarter 2024 Earnings Release and Conference Call
- Trupanion Publishes 2023 Annual Letter to Shareholders
- SHAREHOLDER ALERT: Pomerantz Law Firm Investigates Claims On Behalf of Investors of Trupanion Inc. - TRUP