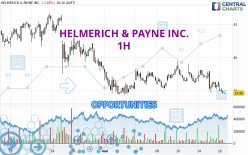
Londinia Opportunities Analyses - 05/16/2024 (GMT) HELMERICH & PAYNE INC. - 1H
- U.S. Stocks
- Timeframe : 1H
- - Analysis generated on
- Status : INVALID
Summary of the analysis
Trends
Short term:
Strongly bearish
Underlying:
Strongly bearish
Technical indicators
11%
61%
28%
My opinion
Bearish under 38.21 USD
My targets
37.47 USD (-0.98%)
35.59 USD (-5.95%)
My analysis
All elements being clearly bearish, it would be possible for traders to trade only short positions (for sale) on HELMERICH & PAYNE INC. as long as the price remains well below 38.21 USD. The sellers' bearish objective is set at 37.47 USD. A bearish break of this support would revive the bearish momentum. The sellers could then target the support located at 35.59 USD. In case of crossing, the next objective would be the support located at 32.29 USD. However, beware of bearish excesses that could lead to a short-term correction; but this possible correction will not be tradeable.
Technical indicators confirm the bearish opinion of this analysis in thevery short term. However, be careful of excessive bearish movements. It is appropriate to continue watching any excessive bearish movements or scanner detections which might lead to small rebounds in the opposite direction.
Force
0
10
7.7

Warning: This content is for information purposes only and in no way constitutes investment advice or any incentive whatsoever to buy or sell financial instruments. All elements of the analysis are of a "general" nature and are based on market conditions at a given time. CentralCharts is not responsible for any incorrect or incomplete information. Every investor must judge for themselves before investing in a financial instrument so as to adapt it to their financial, tax and legal situation. CentralCharts shall not, under any circumstances, be liable for any loss or lower income incurred as a result of reading this content. Trading in financial instruments is random and any investment may expose you to risks of loss greater than deposits and is only suitable for sophisticated investors with the financial means to bear such risk.
Additional analysis
Quotes
HELMERICH & PAYNE INC. rating 37.84 USD. The price registered a decrease of -1.71% on the session with the lowest point at 37.76 USD and the highest point at 38.38 USD. The deviation from the price is +0.21% for the low point and -1.41% for the high point.37.76
38.38
37.84
The Central Gaps scanner detects a bearish opening. A small advantage for sellers in the very short term.
Bearish opening
Type : Bearish
Timeframe : Openning
A study of price movements over other periods shows the following variations:
Near a new LOW record (1 month)
Type : Bearish
Timeframe : Weekly
Technical
A technical analysis in 1H of this HELMERICH & PAYNE INC. chart shows a sharp bearish trend. 92.86% of the signals given by moving averages are bearish. The overall trend is supported by the strong bearish signals from short-term moving averages. There is no crossing of moving average by the price or crossing of moving averages between themselves.
An assessment of technical indicators shows a bearish signal.
Caution: the Central Indicators scanner currently detects an excess:
CCI indicator is oversold : under -100
Type : Neutral
Timeframe : 1 hour
Williams %R indicator is oversold : under -80
Type : Neutral
Timeframe : 1 hour
Price is back under the pivot point
Type : Bearish
Timeframe : Weekly
No signals are given by Central Patterns, a market scanner specialised in chart patterns, resistances and supports.
The Central Candlesticks scanner which studies Japanese candlesticks did not detect anything.
ProTrendLines
S3
S2
S1
R1
R2
R3
Price
| S3 | S2 | S1 | Price | R1 | R2 | R3 | |
|---|---|---|---|---|---|---|---|
| ProTrendLines | 32.29 | 35.59 | 37.47 | 37.84 | 38.21 | 39.51 | 40.03 |
| Change (%) | -14.67% | -5.95% | -0.98% | - | +0.98% | +4.41% | +5.79% |
| Change | -5.55 | -2.25 | -0.37 | - | +0.37 | +1.67 | +2.19 |
| Level | Intermediate | Major | Minor | - | Major | Intermediate | Major |
Attention could also be paid to pivot points to set price objectives:
Daily
| Pivot points | S3 | S2 | S1 | PP | R1 | R2 | R3 |
|---|---|---|---|---|---|---|---|
| Standard | 36.28 | 36.94 | 37.60 | 38.26 | 38.92 | 39.58 | 40.24 |
| Camarilla | 37.89 | 38.01 | 38.13 | 38.25 | 38.37 | 38.49 | 38.61 |
| Woodie | 36.27 | 36.94 | 37.59 | 38.26 | 38.91 | 39.58 | 40.23 |
| Fibonacci | 36.94 | 37.45 | 37.76 | 38.26 | 38.77 | 39.08 | 39.58 |
Weekly
| Pivot points | S3 | S2 | S1 | PP | R1 | R2 | R3 |
|---|---|---|---|---|---|---|---|
| Standard | 35.99 | 36.90 | 37.70 | 38.61 | 39.41 | 40.32 | 41.12 |
| Camarilla | 38.03 | 38.19 | 38.34 | 38.50 | 38.66 | 38.81 | 38.97 |
| Woodie | 35.94 | 36.87 | 37.65 | 38.58 | 39.36 | 40.29 | 41.07 |
| Fibonacci | 36.90 | 37.55 | 37.96 | 38.61 | 39.26 | 39.67 | 40.32 |
Monthly
| Pivot points | S3 | S2 | S1 | PP | R1 | R2 | R3 |
|---|---|---|---|---|---|---|---|
| Standard | 32.22 | 35.49 | 37.28 | 40.55 | 42.34 | 45.61 | 47.40 |
| Camarilla | 37.68 | 38.14 | 38.61 | 39.07 | 39.53 | 40.00 | 40.46 |
| Woodie | 31.48 | 35.12 | 36.54 | 40.18 | 41.60 | 45.24 | 46.66 |
| Fibonacci | 35.49 | 37.42 | 38.62 | 40.55 | 42.48 | 43.68 | 45.61 |
Numerical data
The following is the status of technical indicators and moving averages registered at the time this technical analysis was created:
Technical indicators
Moving averages
| RSI (14): | 39.90 | |
| MACD (12,26,9): | -0.1600 | |
| Directional Movement: | -5.25 | |
| AROON (14): | -42.86 | |
| DEMA (21): | 38.05 | |
| Parabolic SAR (0,02-0,02-0,2): | 38.51 | |
| Elder Ray (13): | -0.26 | |
| Super Trend (3,10): | 38.91 | |
| Zig ZAG (10): | 37.82 | |
| VORTEX (21): | 0.9000 | |
| Stochastique (14,3,5): | 22.65 | |
| TEMA (21): | 37.93 | |
| Williams %R (14): | -84.31 | |
| Chande Momentum Oscillator (20): | -0.76 | |
| Repulse (5,40,3): | -0.6200 | |
| ROCnROLL: | 2 | |
| TRIX (15,9): | -0.0400 | |
| Courbe Coppock: | 3.08 |
| MA7: | 38.43 | |
| MA20: | 39.31 | |
| MA50: | 40.47 | |
| MA100: | 38.43 | |
| MAexp7: | 37.97 | |
| MAexp20: | 38.23 | |
| MAexp50: | 38.44 | |
| MAexp100: | 38.89 | |
| Price / MA7: | -1.54% | |
| Price / MA20: | -3.74% | |
| Price / MA50: | -6.50% | |
| Price / MA100: | -1.54% | |
| Price / MAexp7: | -0.34% | |
| Price / MAexp20: | -1.02% | |
| Price / MAexp50: | -1.56% | |
| Price / MAexp100: | -2.70% |
Quotes :
-
15 min delayed data
-
Actions NYSE
News
The last news published on HELMERICH & PAYNE INC. at the time of the generation of this analysis was as follows:
- Helmerich & Payne, Inc. Announces Fiscal Third Quarter Results
- Helmerich & Payne, Inc. Announces the Appointment of New Director
- Helmerich & Payne, Inc. Announces Fiscal Third Quarter 2023 Conference Call and Webcast
- Helmerich & Payne, Inc. To Participate in J.P. Morgan 2023 Energy, Power and Renewables Conference
- Helmerich & Payne, Inc. To Participate in Conferences in May 2023