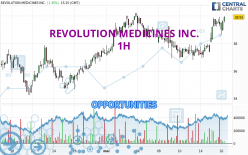
Londinia Opportunities Analyses - 05/16/2024 (GMT) REVOLUTION MEDICINES INC. - 1H
- U.S. Stocks
- Timeframe : 1H
- - Analysis generated on
- Status : INVALID
Summary of the analysis
Trends
Short term:
Strongly bullish
Underlying:
Strongly bullish
Technical indicators
78%
0%
22%
My opinion
Bullish above 39.49 USD
My targets
40.21 USD (+1.06%)
41.74 USD (+4.90%)
My analysis
All elements being clearly bullish, it would be possible for traders to trade only long positions (at the time of purchase) on REVOLUTION MEDICINES INC. as long as the price remains well above 39.49 USD. The buyers' bullish objective is set at 40.21 USD. A bullish break in this resistance would boost the bullish momentum. The buyers could then target the resistance located at 41.74 USD. If there is any crossing, the next objective would be the resistance located at 45.47 USD. However, beware of bullish excesses that could lead to a possible short-term correction; but this possible correction would not be tradeable.
Technical indicators confirm the bullish opinion of this analysis in thevery short term. However, be careful of excessive bullish movements. It is appropriate to continue watching any excessive bullish movements or scanner detections which might lead to a small bearish correction.
Force
0
10
8.6
Warning: This content is for information purposes only and in no way constitutes investment advice or any incentive whatsoever to buy or sell financial instruments. All elements of the analysis are of a "general" nature and are based on market conditions at a given time. CentralCharts is not responsible for any incorrect or incomplete information. Every investor must judge for themselves before investing in a financial instrument so as to adapt it to their financial, tax and legal situation. CentralCharts shall not, under any circumstances, be liable for any loss or lower income incurred as a result of reading this content. Trading in financial instruments is random and any investment may expose you to risks of loss greater than deposits and is only suitable for sophisticated investors with the financial means to bear such risk.
Additional analysis
Quotes
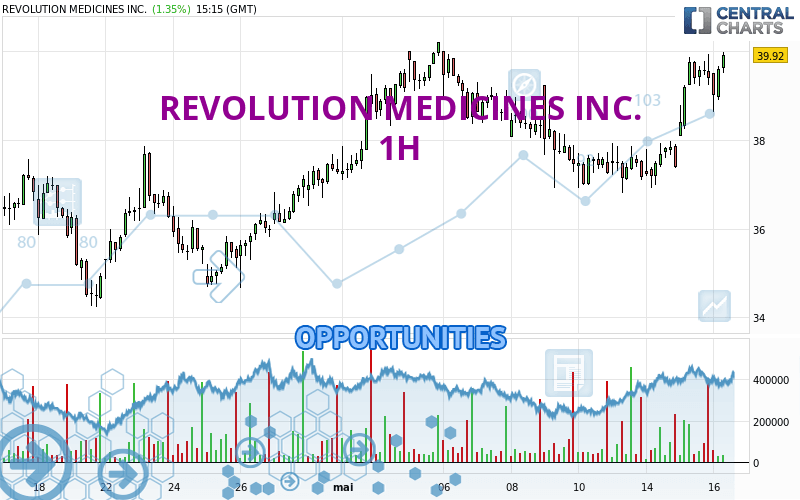
The REVOLUTION MEDICINES INC. rating is 39.79 USD. The price registered an increase of +1.02% on the session with the lowest point at 38.69 USD and the highest point at 39.79 USD. The deviation from the price is +2.84% for the low point and 0% for the high point.38.69
39.79
39.79
So that you have an overall view of the price change, here is a table showing the variations over several periods:
Near a new HIGH record (1 year)
Type : Bullish
Timeframe : Weekly
Near a new HIGH record (1st january)
Type : Bullish
Timeframe : Weekly
Near a new HIGH record (1 month)
Type : Bullish
Timeframe : Weekly
Technical
Technical analysis of this 1H chart of REVOLUTION MEDICINES INC. indicates that the overall trend is strongly bullish. The signals given by the moving averages are 92.86% bullish. This strong bullish trend is confirmed by the strong signals currently being given by short-term moving averages. The Central Indicators market scanner currently does not detect any result that concerns moving averages.
In fact, 14 technical indicators on 18 studied are currently bullish. Caution: the Central Indicators scanner currently detects an excess:
Williams %R indicator is overbought : over -20
Type : Neutral
Timeframe : 1 hour
Pivot points : price is over resistance 1
Type : Neutral
Timeframe : Weekly
Price is back over the pivot point
Type : Bullish
Timeframe : 1 hour
No signals are given by Central Patterns, a market scanner specialised in chart patterns, resistances and supports.
Central Candlesticks, the scanner specialised in Japanese candlesticks, detects a bullish signal that could support the hypothesis of a small rebound in the very short term:
Bullish engulfing lines
Type : Bullish
Timeframe : 1 hour
ProTrendLines
S3
S2
S1
R1
R2
R3
Price
| S3 | S2 | S1 | Price | R1 | R2 | R3 | |
|---|---|---|---|---|---|---|---|
| ProTrendLines | 37.41 | 37.89 | 39.49 | 39.79 | 40.21 | 41.74 | 45.47 |
| Change (%) | -5.98% | -4.78% | -0.75% | - | +1.06% | +4.90% | +14.27% |
| Change | -2.38 | -1.90 | -0.30 | - | +0.42 | +1.95 | +5.68 |
| Level | Minor | Major | Minor | - | Major | Intermediate | Intermediate |
Pivot points can also be used to set your price objectives. Here is the price situation in relation to pivot points:
Daily
| Pivot points | S3 | S2 | S1 | PP | R1 | R2 | R3 |
|---|---|---|---|---|---|---|---|
| Standard | 36.49 | 37.28 | 38.34 | 39.13 | 40.19 | 40.98 | 42.04 |
| Camarilla | 38.88 | 39.05 | 39.22 | 39.39 | 39.56 | 39.73 | 39.90 |
| Woodie | 36.62 | 37.35 | 38.47 | 39.20 | 40.32 | 41.05 | 42.17 |
| Fibonacci | 37.28 | 37.99 | 38.43 | 39.13 | 39.84 | 40.28 | 40.98 |
Weekly
| Pivot points | S3 | S2 | S1 | PP | R1 | R2 | R3 |
|---|---|---|---|---|---|---|---|
| Standard | 33.00 | 34.96 | 36.10 | 38.06 | 39.20 | 41.16 | 42.30 |
| Camarilla | 36.40 | 36.68 | 36.97 | 37.25 | 37.53 | 37.82 | 38.10 |
| Woodie | 32.60 | 34.76 | 35.70 | 37.86 | 38.80 | 40.96 | 41.90 |
| Fibonacci | 34.96 | 36.14 | 36.87 | 38.06 | 39.24 | 39.97 | 41.16 |
Monthly
| Pivot points | S3 | S2 | S1 | PP | R1 | R2 | R3 |
|---|---|---|---|---|---|---|---|
| Standard | 22.46 | 26.01 | 31.64 | 35.19 | 40.82 | 44.37 | 50.00 |
| Camarilla | 34.76 | 35.60 | 36.44 | 37.28 | 38.12 | 38.96 | 39.81 |
| Woodie | 23.51 | 26.53 | 32.69 | 35.71 | 41.87 | 44.89 | 51.05 |
| Fibonacci | 26.01 | 29.51 | 31.68 | 35.19 | 38.69 | 40.86 | 44.37 |
Numerical data
The following is the status of the technical indicators and moving averages at the time of publication of this technical analysis:
Technical indicators
Moving averages
| RSI (14): | 62.86 | |
| MACD (12,26,9): | 0.4600 | |
| Directional Movement: | 5.94 | |
| AROON (14): | 85.71 | |
| DEMA (21): | 39.13 | |
| Parabolic SAR (0,02-0,02-0,2): | 38.54 | |
| Elder Ray (13): | 0.34 | |
| Super Trend (3,10): | 37.91 | |
| Zig ZAG (10): | 39.57 | |
| VORTEX (21): | 1.0700 | |
| Stochastique (14,3,5): | 79.92 | |
| TEMA (21): | 39.61 | |
| Williams %R (14): | -12.07 | |
| Chande Momentum Oscillator (20): | 1.88 | |
| Repulse (5,40,3): | 0.9800 | |
| ROCnROLL: | 1 | |
| TRIX (15,9): | 0.1100 | |
| Courbe Coppock: | 10.43 |
| MA7: | 38.08 | |
| MA20: | 37.57 | |
| MA50: | 34.68 | |
| MA100: | 31.78 | |
| MAexp7: | 39.26 | |
| MAexp20: | 38.62 | |
| MAexp50: | 38.25 | |
| MAexp100: | 37.75 | |
| Price / MA7: | +4.49% | |
| Price / MA20: | +5.91% | |
| Price / MA50: | +14.73% | |
| Price / MA100: | +25.20% | |
| Price / MAexp7: | +1.35% | |
| Price / MAexp20: | +3.03% | |
| Price / MAexp50: | +4.03% | |
| Price / MAexp100: | +5.40% |
Quotes :
-
15 min delayed data
-
Actions NASDAQ
News
Don't forget to follow the news on REVOLUTION MEDICINES INC.. At the time of publication of this analysis, the latest news was as follows:
- Revolution Medicines Reports First Quarter 2024 Financial Results and Update on Corporate Progress
- Revolution Medicines to Report Financial Results for First Quarter 2024 After Market Close on May 8, 2024
- Revolution Medicines Announces Publication on the Discovery of and Translational Research for RMC-6236, an Investigational RAS(ON) Multi-Selective Tri-Complex Inhibitor Designed to Block Full Spectrum of Oncogenic RAS(ON) Proteins
- Revolution Medicines Announces Publications on the Discovery and Preclinical Profile of Representative of a New Class of RAS(ON) Multi-Selective Inhibitors Designed to Block Full Spectrum of Oncogenic RAS(ON) Proteins
- Revolution Medicines to Participate in Upcoming Investor Conferences