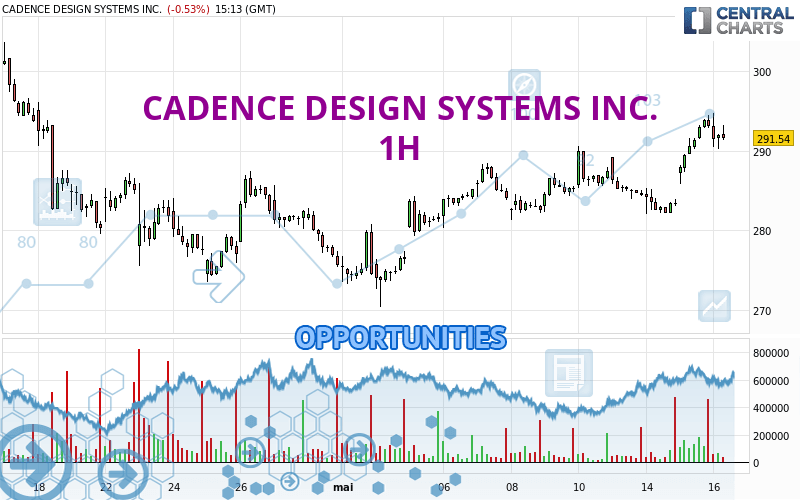
Londinia Opportunities Analyses - 05/16/2024 (GMT) CADENCE DESIGN SYSTEMS INC. - 1H
- U.S. Stocks
- Timeframe : 1H
- - Analysis generated on
- Status : INVALID
Summary of the analysis
Trends
Short term:
Strongly bullish
Underlying:
Strongly bullish
Technical indicators
78%
6%
17%
My opinion
Bullish above 290.30 USD
My targets
298.44 USD (+1.99%)
303.71 USD (+3.79%)
My analysis
The bullish trend is currently very strong on CADENCE DESIGN SYSTEMS INC.. As long as the price remains above the support at 290.30 USD, you could try to benefit from the boom. The first bullish objective is located at 298.44 USD. The bullish momentum would be boosted by a break in this resistance. Buyers would then use the next resistance located at 303.71 USD as an objective. Crossing it would then enable buyers to target 311.83 USD. Be careful, given the powerful bullish rally underway, excesses could lead to a possible correction in the short term. If this is the case, remember that trading against the trend may be riskier. It would seem more appropriate to wait for a signal indicating reversal of the trend.
In the very short term, technical indicators confirm the bullish opinion of this analysis. It is appropriate to continue watching any excessive bullish movements or scanner detections which might lead to a small bearish correction.
Force
0
10
8.4

Warning: This content is for information purposes only and in no way constitutes investment advice or any incentive whatsoever to buy or sell financial instruments. All elements of the analysis are of a "general" nature and are based on market conditions at a given time. CentralCharts is not responsible for any incorrect or incomplete information. Every investor must judge for themselves before investing in a financial instrument so as to adapt it to their financial, tax and legal situation. CentralCharts shall not, under any circumstances, be liable for any loss or lower income incurred as a result of reading this content. Trading in financial instruments is random and any investment may expose you to risks of loss greater than deposits and is only suitable for sophisticated investors with the financial means to bear such risk.
Additional analysis
Quotes
The CADENCE DESIGN SYSTEMS INC. rating is 292.62 USD. The price is lower by -0.16% since the last closing and was traded between 290.23 USD and 294.74 USD over the period. The price is currently at +0.82% from its lowest and -0.72% from its highest.290.23
294.74
292.62
Here is a more detailed summary of the historical variations registered by CADENCE DESIGN SYSTEMS INC.:
Near a new HIGH record (1 month)
Type : Bullish
Timeframe : Weekly
Technical
Technical analysis of CADENCE DESIGN SYSTEMS INC. in 1H shows a strongly overall bullish trend. The signals given by the moving averages are 92.86% bullish. This strong bullish trend is confirmed by the strong signals currently being given by short-term moving averages. The Central Indicators market scanner currently does not detect any result that concerns moving averages.
The probability of a further increase is high given the direction of the technical indicators.
The Central Indicators scanner specialised in technical indicators, has not detected anything further.
An analysis of the price chart with the Central Patterns scanner (detector of chart patterns and resistances and supports) shows a result that can have an impact on the price change:
Near horizontal support
Type : Bullish
Timeframe : 1 hour
Central Candlesticks, the scanner specialised in Japanese candlesticks, detects these signals that could have an impact on the current short-term trend:
White hanging man / hammer
Type : Neutral
Timeframe : 1 hour
Bullish harami
Type : Bullish
Timeframe : 1 hour
ProTrendLines
S3
S2
S1
R1
R2
R3
Price
| S3 | S2 | S1 | Price | R1 | R2 | R3 | |
|---|---|---|---|---|---|---|---|
| ProTrendLines | 274.92 | 282.11 | 290.30 | 292.62 | 298.44 | 303.71 | 311.83 |
| Change (%) | -6.05% | -3.59% | -0.79% | - | +1.99% | +3.79% | +6.56% |
| Change | -17.70 | -10.51 | -2.32 | - | +5.82 | +11.09 | +19.21 |
| Level | Major | Intermediate | Intermediate | - | Intermediate | Intermediate | Intermediate |
Pivot points can also be used to set your price objectives. Here is the price situation in relation to pivot points:
Daily
| Pivot points | S3 | S2 | S1 | PP | R1 | R2 | R3 |
|---|---|---|---|---|---|---|---|
| Standard | 279.21 | 282.51 | 287.81 | 291.11 | 296.41 | 299.71 | 305.01 |
| Camarilla | 290.74 | 291.52 | 292.31 | 293.10 | 293.89 | 294.68 | 295.47 |
| Woodie | 280.20 | 283.01 | 288.80 | 291.61 | 297.40 | 300.21 | 306.00 |
| Fibonacci | 282.51 | 285.80 | 287.83 | 291.11 | 294.40 | 296.43 | 299.71 |
Weekly
| Pivot points | S3 | S2 | S1 | PP | R1 | R2 | R3 |
|---|---|---|---|---|---|---|---|
| Standard | 271.38 | 275.83 | 281.65 | 286.10 | 291.92 | 296.37 | 302.19 |
| Camarilla | 284.66 | 285.60 | 286.54 | 287.48 | 288.42 | 289.36 | 290.30 |
| Woodie | 272.08 | 276.17 | 282.35 | 286.44 | 292.62 | 296.71 | 302.89 |
| Fibonacci | 275.83 | 279.75 | 282.17 | 286.10 | 290.02 | 292.44 | 296.37 |
Monthly
| Pivot points | S3 | S2 | S1 | PP | R1 | R2 | R3 |
|---|---|---|---|---|---|---|---|
| Standard | 216.78 | 245.14 | 260.38 | 288.74 | 303.98 | 332.34 | 347.58 |
| Camarilla | 263.64 | 267.64 | 271.63 | 275.63 | 279.63 | 283.62 | 287.62 |
| Woodie | 210.23 | 241.86 | 253.83 | 285.46 | 297.43 | 329.06 | 341.03 |
| Fibonacci | 245.14 | 261.79 | 272.08 | 288.74 | 305.39 | 315.68 | 332.34 |
Numerical data
The following is the status of the technical indicators and moving averages at the time of publication of this technical analysis:
Technical indicators
Moving averages
| RSI (14): | 64.60 | |
| MACD (12,26,9): | 2.0700 | |
| Directional Movement: | 15.96 | |
| AROON (14): | 71.43 | |
| DEMA (21): | 291.07 | |
| Parabolic SAR (0,02-0,02-0,2): | 287.57 | |
| Elder Ray (13): | 1.30 | |
| Super Trend (3,10): | 288.41 | |
| Zig ZAG (10): | 291.71 | |
| VORTEX (21): | 1.0600 | |
| Stochastique (14,3,5): | 79.01 | |
| TEMA (21): | 292.35 | |
| Williams %R (14): | -23.95 | |
| Chande Momentum Oscillator (20): | 8.78 | |
| Repulse (5,40,3): | -0.0700 | |
| ROCnROLL: | 1 | |
| TRIX (15,9): | 0.0600 | |
| Courbe Coppock: | 5.45 |
| MA7: | 286.88 | |
| MA20: | 282.60 | |
| MA50: | 298.10 | |
| MA100: | 293.34 | |
| MAexp7: | 291.39 | |
| MAexp20: | 288.65 | |
| MAexp50: | 286.31 | |
| MAexp100: | 285.91 | |
| Price / MA7: | +2.00% | |
| Price / MA20: | +3.55% | |
| Price / MA50: | -1.84% | |
| Price / MA100: | -0.25% | |
| Price / MAexp7: | +0.42% | |
| Price / MAexp20: | +1.38% | |
| Price / MAexp50: | +2.20% | |
| Price / MAexp100: | +2.35% |
Quotes :
-
15 min delayed data
-
Actions NASDAQ
News
Don't forget to follow the news on CADENCE DESIGN SYSTEMS INC.. At the time of publication of this analysis, the latest news was as follows:
- Longhorn Electric Racing Is Building the Future of Electric Vehicles With Cadence Tools
- Cadence Named by Fortune and Great Place to Work as One of 2024’s 100 Best Companies to Work For, Ranking No. 9
- ¡Felicidades! To Cadence's 2023 Latinx Students in Technology Scholarship Recipients
- Cadence 2023 Environmental, Social and Governance Report
- SJSU Is Providing Hands-On Rocketry Experience to Its Students