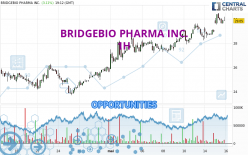
Londinia Opportunities Analyses - 05/15/2024 (GMT) BRIDGEBIO PHARMA INC. - 1H
I am delighted to see that my first price objective has been achieved. I hope you've taken advantage of it.
- U.S. Stocks
- Timeframe : 1H
- - Analysis generated on
- Status : TARGET REACHED
Summary of the analysis
Trends
Short term:
Strongly bullish
Underlying:
Strongly bullish
Technical indicators
83%
6%
11%
My opinion
Bullish above 29.61 USD
My targets
30.92 USD (+2.83%)
31.79 USD (+5.71%)
My analysis
All elements being clearly bullish, it would be possible for traders to trade only long positions (at the time of purchase) on BRIDGEBIO PHARMA INC. as long as the price remains well above 29.61 USD. The buyers' bullish objective is set at 30.92 USD. A bullish break in this resistance would boost the bullish momentum. The buyers could then target the resistance located at 31.79 USD. If there is any crossing, the next objective would be the resistance located at 35.01 USD. However, beware of bullish excesses that could lead to a possible short-term correction; but this possible correction would not be tradeable.
In the very short term, the general bullish sentiment is confirmed by technical indicators. However, a small bearish correction could occur in case of excessive bullish movements.
Force
0
10
8.6

Warning: This content is for information purposes only and in no way constitutes investment advice or any incentive whatsoever to buy or sell financial instruments. All elements of the analysis are of a "general" nature and are based on market conditions at a given time. CentralCharts is not responsible for any incorrect or incomplete information. Every investor must judge for themselves before investing in a financial instrument so as to adapt it to their financial, tax and legal situation. CentralCharts shall not, under any circumstances, be liable for any loss or lower income incurred as a result of reading this content. Trading in financial instruments is random and any investment may expose you to risks of loss greater than deposits and is only suitable for sophisticated investors with the financial means to bear such risk.
Additional analysis
Quotes
BRIDGEBIO PHARMA INC. rating 30.07 USD. The price registered an increase of +3.87% on the session and was traded between 29.54 USD and 30.48 USD over the period. The price is currently at +1.79% from its lowest and -1.35% from its highest.29.54
30.48
30.07
A bullish gap was detected at the opening by the Central Gaps scanner. There are a lot of buyers and they have the upper hand in the very short term.
Opening Gap UP
Type : Bullish
Timeframe : Openning
A study of price movements over other periods shows the following variations:
New HIGH record (1 month)
Type : Bullish
Timeframe : Weekly
Technical
Technical analysis of BRIDGEBIO PHARMA INC. in 1H shows a strongly overall bullish trend. The signals given by the moving averages are 92.86% bullish. This strong bullish trend is confirmed by the strong signals currently being given by short-term moving averages. There is no crossing of moving average by the price or crossing of moving averages between themselves.
The probability of a further increase is high given the direction of the technical indicators.
Central Indicators, the detector scanner for these technical indicators recently detected a signal:
Pivot points : price is over resistance 1
Type : Neutral
Timeframe : 1 hour
No signals are given by Central Patterns, a market scanner specialised in chart patterns, resistances and supports.
From the Japanese candlestick perspective, the Central Candlesticks scanner notes the presence of these results that could impact the short-term trend:
White hanging man / hammer
Type : Neutral
Timeframe : 1 hour
Black hanging man / hammer
Type : Neutral
Timeframe : 1 hour
Doji
Type : Neutral
Timeframe : 1 hour
ProTrendLines
S3
S2
S1
R1
R2
R3
Price
| S3 | S2 | S1 | Price | R1 | R2 | R3 | |
|---|---|---|---|---|---|---|---|
| ProTrendLines | 28.15 | 28.77 | 29.61 | 30.07 | 30.92 | 35.01 | 36.92 |
| Change (%) | -6.39% | -4.32% | -1.53% | - | +2.83% | +16.43% | +22.78% |
| Change | -1.92 | -1.30 | -0.46 | - | +0.85 | +4.94 | +6.85 |
| Level | Minor | Major | Intermediate | - | Intermediate | Minor | Minor |
To determine price objectives, it is also possible to use the pivot points. Here is the price position in relation to pivot points:
Daily
| Pivot points | S3 | S2 | S1 | PP | R1 | R2 | R3 |
|---|---|---|---|---|---|---|---|
| Standard | 27.46 | 27.91 | 28.43 | 28.88 | 29.40 | 29.85 | 30.37 |
| Camarilla | 28.68 | 28.77 | 28.86 | 28.95 | 29.04 | 29.13 | 29.22 |
| Woodie | 27.50 | 27.93 | 28.47 | 28.90 | 29.44 | 29.87 | 30.41 |
| Fibonacci | 27.91 | 28.28 | 28.51 | 28.88 | 29.25 | 29.48 | 29.85 |
Weekly
| Pivot points | S3 | S2 | S1 | PP | R1 | R2 | R3 |
|---|---|---|---|---|---|---|---|
| Standard | 25.79 | 26.47 | 27.79 | 28.47 | 29.79 | 30.47 | 31.79 |
| Camarilla | 28.55 | 28.73 | 28.92 | 29.10 | 29.28 | 29.47 | 29.65 |
| Woodie | 26.10 | 26.63 | 28.10 | 28.63 | 30.10 | 30.63 | 32.10 |
| Fibonacci | 26.47 | 27.24 | 27.71 | 28.47 | 29.24 | 29.71 | 30.47 |
Monthly
| Pivot points | S3 | S2 | S1 | PP | R1 | R2 | R3 |
|---|---|---|---|---|---|---|---|
| Standard | 15.21 | 19.45 | 22.53 | 26.77 | 29.85 | 34.09 | 37.17 |
| Camarilla | 23.61 | 24.28 | 24.95 | 25.62 | 26.29 | 26.96 | 27.63 |
| Woodie | 14.64 | 19.16 | 21.96 | 26.48 | 29.28 | 33.80 | 36.60 |
| Fibonacci | 19.45 | 22.24 | 23.97 | 26.77 | 29.56 | 31.29 | 34.09 |
Numerical data
The following is the status of technical indicators and moving averages registered at the time this technical analysis was created:
Technical indicators
Moving averages
| RSI (14): | 58.84 | |
| MACD (12,26,9): | 0.3800 | |
| Directional Movement: | 18.06 | |
| AROON (14): | 71.43 | |
| DEMA (21): | 29.73 | |
| Parabolic SAR (0,02-0,02-0,2): | 28.88 | |
| Elder Ray (13): | 0.25 | |
| Super Trend (3,10): | 28.80 | |
| Zig ZAG (10): | 29.70 | |
| VORTEX (21): | 1.0700 | |
| Stochastique (14,3,5): | 68.80 | |
| TEMA (21): | 29.86 | |
| Williams %R (14): | -29.96 | |
| Chande Momentum Oscillator (20): | 0.88 | |
| Repulse (5,40,3): | -0.5200 | |
| ROCnROLL: | 1 | |
| TRIX (15,9): | 0.1700 | |
| Courbe Coppock: | 5.49 |
| MA7: | 28.67 | |
| MA20: | 26.83 | |
| MA50: | 27.79 | |
| MA100: | 32.19 | |
| MAexp7: | 29.70 | |
| MAexp20: | 29.24 | |
| MAexp50: | 28.57 | |
| MAexp100: | 27.89 | |
| Price / MA7: | +4.88% | |
| Price / MA20: | +12.08% | |
| Price / MA50: | +8.20% | |
| Price / MA100: | -6.59% | |
| Price / MAexp7: | +1.25% | |
| Price / MAexp20: | +2.84% | |
| Price / MAexp50: | +5.25% | |
| Price / MAexp100: | +7.82% |
Quotes :
-
15 min delayed data
-
Actions NASDAQ
News
Don't forget to follow the news on BRIDGEBIO PHARMA INC.. At the time of publication of this analysis, the latest news was as follows:
- BridgeBio Pharma Reports Inducement Grants under Nasdaq Listing Rule 5635(c)(4)
- BridgeBio Pharma to Participate in the Bank of America Merrill Lynch Global Healthcare Conference 2024
- BridgeBio Pharma Presents Additional Data and Analyses from its Phase 3 ATTRibute-CM Study in Transthyretin Amyloid Cardiomyopathy (ATTR-CM) at ESC-HF, Including That Acoramidis Treatment Significantly Reduced All-Cause Mortality in a Pre-specified Sensitivity Analysis of the Entire Study Population
- BridgeBio Pharma Reports First Quarter 2024 Financial Results and Business Update
- BridgeBio launches BridgeBio Oncology Therapeutics (BBOT) with $200M of private external capital to accelerate the development of its novel precision oncology pipeline