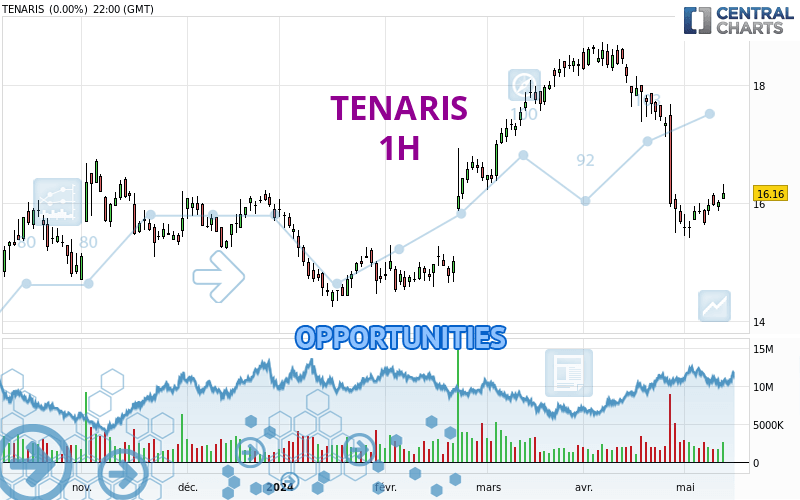
Londinia Opportunities Analyses - 05/15/2024 (GMT) TENARIS - 1H
-
EUR
(-)
-
15 min delayed data - Italy Stocks
| Type: | Stocks |
| Ticker: | TEN |
| ISIN: | LU2598331598 |
- Europe Stocks
- Timeframe : 1H
- - Analysis generated on
- Status : INVALID
Summary of the analysis
Trends
Short term:
Strongly bullish
Underlying:
Strongly bullish
Technical indicators
89%
0%
11%
My opinion
Bullish above 16.086 EUR
My targets
16.652 EUR (+2.16%)
17.680 EUR (+8.47%)
My analysis
TENARIS is part of a very strong bullish trend. Traders may consider trading only long positions (at the time of purchase) as long as the price remains well above 16.086 EUR. The next resistance located at 16.652 EUR is the next bullish objective to be reached. A bullish break in this resistance would boost the bullish momentum. The bullish movement could then continue towards the next resistance located at 17.680 EUR. After this resistance, buyers could then target 18.293 EUR. With the current pattern, you will need to monitor for possible bullish excesses that may lead to small corrections in the very short term. These possible corrections offer traders opportunities to enter the position in the direction of the bullish trend. Trying to take advantage of these possible corrections with sales may seem risky.
In the very short term, the general bullish sentiment is confirmed by technical indicators. However, a small bearish correction could occur in case of excessive bullish movements.
Force
0
10
8.2

Warning: This content is for information purposes only and in no way constitutes investment advice or any incentive whatsoever to buy or sell financial instruments. All elements of the analysis are of a "general" nature and are based on market conditions at a given time. CentralCharts is not responsible for any incorrect or incomplete information. Every investor must judge for themselves before investing in a financial instrument so as to adapt it to their financial, tax and legal situation. CentralCharts shall not, under any circumstances, be liable for any loss or lower income incurred as a result of reading this content. Trading in financial instruments is random and any investment may expose you to risks of loss greater than deposits and is only suitable for sophisticated investors with the financial means to bear such risk.
Additional analysis
Quotes
The TENARIS price is 16.300 EUR. The price registered an increase of +0.87% on the session and was traded between 16.190 EUR and 16.365 EUR over the period. The price is currently at +0.68% from its lowest and -0.40% from its highest.16.190
16.365
16.300
So that you have an overall view of the price change, here is a table showing the variations over several periods:
Near a new LOW record (1 month)
Type : Bearish
Timeframe : Weekly
Technical
A technical analysis in 1H of this TENARIS chart shows a strongly bullish trend. 85.71% of the signals given by moving averages are bullish. This strongly bullish trend is supported by the strong bullish signals given by short-term moving averages. The Central Indicators scanner does not detect any result on moving averages that would impact this trend.
In fact, 16 technical indicators on 18 studied are currently positioned bullish. Caution: the Central Indicators scanner currently detects an excess:
Williams %R indicator is overbought : over -20
Type : Neutral
Timeframe : 1 hour
Pivot points : price is over resistance 1
Type : Neutral
Timeframe : 1 hour
Pivot points : price is over resistance 1
Type : Neutral
Timeframe : Weekly
Central Patterns, the market scanner focusing on chart patterns, resistances and supports found this result:
Resistance of channel is broken
Type : Bullish
Timeframe : 1 hour
Central Candlesticks, the scanner specialised in Japanese candlesticks, detects a bullish signal that could support the hypothesis of a small rebound in the very short term:
Upside gap
Type : Bullish
Timeframe : 1 hour
ProTrendLines
S3
S2
S1
R1
R2
R3
Price
| S3 | S2 | S1 | Price | R1 | R2 | R3 | |
|---|---|---|---|---|---|---|---|
| ProTrendLines | 14.706 | 15.250 | 16.086 | 16.300 | 16.652 | 17.680 | 18.293 |
| Change (%) | -9.78% | -6.44% | -1.31% | - | +2.16% | +8.47% | +12.23% |
| Change | -1.594 | -1.050 | -0.214 | - | +0.352 | +1.380 | +1.993 |
| Level | Major | Major | Major | - | Major | Intermediate | Intermediate |
Pivot points can also be used to set your price objectives. Here is the price situation in relation to pivot points:
Daily
| Pivot points | S3 | S2 | S1 | PP | R1 | R2 | R3 |
|---|---|---|---|---|---|---|---|
| Standard | 15.787 | 15.923 | 16.042 | 16.178 | 16.297 | 16.433 | 16.552 |
| Camarilla | 16.090 | 16.113 | 16.137 | 16.160 | 16.183 | 16.207 | 16.230 |
| Woodie | 15.778 | 15.919 | 16.033 | 16.174 | 16.288 | 16.429 | 16.543 |
| Fibonacci | 15.923 | 16.021 | 16.081 | 16.178 | 16.276 | 16.336 | 16.433 |
Weekly
| Pivot points | S3 | S2 | S1 | PP | R1 | R2 | R3 |
|---|---|---|---|---|---|---|---|
| Standard | 15.113 | 15.367 | 15.663 | 15.917 | 16.213 | 16.467 | 16.763 |
| Camarilla | 15.809 | 15.859 | 15.910 | 15.960 | 16.010 | 16.061 | 16.111 |
| Woodie | 15.135 | 15.378 | 15.685 | 15.928 | 16.235 | 16.478 | 16.785 |
| Fibonacci | 15.367 | 15.577 | 15.707 | 15.917 | 16.127 | 16.257 | 16.467 |
Monthly
| Pivot points | S3 | S2 | S1 | PP | R1 | R2 | R3 |
|---|---|---|---|---|---|---|---|
| Standard | 11.315 | 13.405 | 14.540 | 16.630 | 17.765 | 19.855 | 20.990 |
| Camarilla | 14.788 | 15.084 | 15.379 | 15.675 | 15.971 | 16.266 | 16.562 |
| Woodie | 10.838 | 13.166 | 14.063 | 16.391 | 17.288 | 19.616 | 20.513 |
| Fibonacci | 13.405 | 14.637 | 15.398 | 16.630 | 17.862 | 18.623 | 19.855 |
Numerical data
The following is the status of the technical indicators and moving averages at the time of publication of this technical analysis:
Technical indicators
Moving averages
| RSI (14): | 65.90 | |
| MACD (12,26,9): | 0.0770 | |
| Directional Movement: | 18.260 | |
| AROON (14): | 85.714 | |
| DEMA (21): | 16.231 | |
| Parabolic SAR (0,02-0,02-0,2): | 16.000 | |
| Elder Ray (13): | 0.104 | |
| Super Trend (3,10): | 15.975 | |
| Zig ZAG (10): | 16.305 | |
| VORTEX (21): | 1.0420 | |
| Stochastique (14,3,5): | 72.33 | |
| TEMA (21): | 16.266 | |
| Williams %R (14): | -12.12 | |
| Chande Momentum Oscillator (20): | 0.345 | |
| Repulse (5,40,3): | 0.5400 | |
| ROCnROLL: | 1 | |
| TRIX (15,9): | 0.0620 | |
| Courbe Coppock: | 3.27 |
| MA7: | 15.991 | |
| MA20: | 16.503 | |
| MA50: | 17.377 | |
| MA100: | 16.310 | |
| MAexp7: | 16.235 | |
| MAexp20: | 16.138 | |
| MAexp50: | 16.049 | |
| MAexp100: | 16.187 | |
| Price / MA7: | +1.93% | |
| Price / MA20: | -1.23% | |
| Price / MA50: | -6.20% | |
| Price / MA100: | -0.06% | |
| Price / MAexp7: | +0.40% | |
| Price / MAexp20: | +1.00% | |
| Price / MAexp50: | +1.56% | |
| Price / MAexp100: | +0.70% |
Quotes :
-
15 min delayed data
-
Actions Italie
News
The latest news and videos published on TENARIS at the time of the analysis were as follows:
- Glancy Prongay & Murray LLP Obtains Important Ruling for Tenaris S.A. Investors in Securities Fraud Class Action
- TENARIS 24 HOUR DEADLINE ALERT: Approximately 24 Hours Remain; ClaimsFiler Reminds Investors with Losses in Excess of $100,000 of Deadline in Class Action Lawsuit against Tenaris S.A. - TS
- TENARIS 72 HOUR DEADLINE ALERT: Approximately 72 Hours Remain; Former Louisiana Attorney General and Kahn Swick & Foti, LLC Remind Investors with Losses in Excess of $100,000 of Deadline in Class Action Lawsuit against Tenaris S.A. - TS
- Kessler Topaz Meltzer & Check, LLP: Securities Fraud Class Action Filed Against Tenaris S.A. - TS
- TS LOSS DEADLINE: Rosen Law Firm Files First Securities Class Action Lawsuit Against Tenaris S.A.; Reminds of Important Deadline - TS