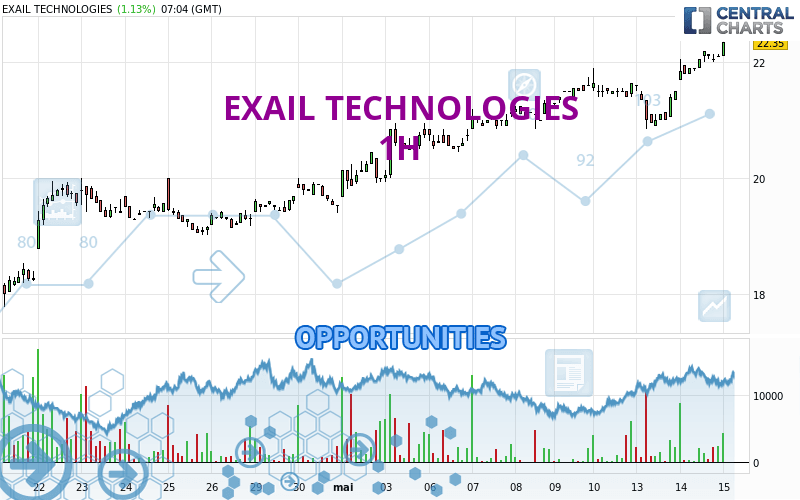
Londinia Opportunities Analyses - 05/15/2024 (GMT) EXAIL TECHNOLOGIES - 1H
-
EUR
(-)
-
15 min delayed data - Euronext Paris
| Type: | Stocks |
| Ticker: | EXA |
| ISIN: | FR0000062671 |
I am pleased to note that the threshold for invalidation has been maintained for 20 Candlesticks.
- Europe Stocks
- Timeframe : 1H
- - Analysis generated on
- Status : LEVEL MAINTAINED
Summary of the analysis
Trends
Short term:
Strongly bullish
Underlying:
Strongly bullish
Technical indicators
78%
6%
17%
My opinion
Bullish above 21.39 EUR
My targets
23.25 EUR (+4.26%)
24.26 EUR (+8.79%)
My analysis
The bullish trend is currently very strong on EXAIL TECHNOLOGIES. As long as the price remains above the support at 21.39 EUR, you could try to benefit from the boom. The first bullish objective is located at 23.25 EUR. The bullish momentum would be boosted by a break in this resistance. Buyers would then use the next resistance located at 24.26 EUR as an objective. Crossing it would then enable buyers to target 24.90 EUR. Be careful, given the powerful bullish rally underway, excesses could lead to a possible correction in the short term. If this is the case, remember that trading against the trend may be riskier. It would seem more appropriate to wait for a signal indicating reversal of the trend.
In the very short term, the general bullish sentiment is confirmed by technical indicators. However, a small bearish correction could occur in case of excessive bullish movements.
Force
0
10
8.4

Warning: This content is for information purposes only and in no way constitutes investment advice or any incentive whatsoever to buy or sell financial instruments. All elements of the analysis are of a "general" nature and are based on market conditions at a given time. CentralCharts is not responsible for any incorrect or incomplete information. Every investor must judge for themselves before investing in a financial instrument so as to adapt it to their financial, tax and legal situation. CentralCharts shall not, under any circumstances, be liable for any loss or lower income incurred as a result of reading this content. Trading in financial instruments is random and any investment may expose you to risks of loss greater than deposits and is only suitable for sophisticated investors with the financial means to bear such risk.
Additional analysis
Quotes
The EXAIL TECHNOLOGIES price is 22.30 EUR. The price registered an increase of +0.91% on the session with the lowest point at 22.10 EUR and the highest point at 22.30 EUR. The deviation from the price is +0.90% for the low point and 0% for the high point.22.10
22.30
22.30
The Central Gaps scanner detects the formation of a bullish gap marking the strong presence of buyers against sellers at the opening. This formed a quotation gap.
Opening Gap UP
Type : Bullish
Timeframe : Openning
So that you have an overall view of the price change, here is a table showing the variations over several periods:
Abnormal volumes
Timeframe : 20 days
Abnormal volumes
Timeframe : 50 days
Technical
A technical analysis in 1H of this EXAIL TECHNOLOGIES chart shows a strongly bullish trend. The signals given by the moving averages are 92.86% bullish. This strong bullish trend is confirmed by the strong signals currently being given by short-term moving averages. The Central Indicators market scanner currently does not detect any result that concerns moving averages.
In fact, 14 technical indicators on 18 studied are currently positioned bullish. Caution: the Central Indicators scanner currently detects an excess:
Williams %R indicator is overbought : over -20
Type : Neutral
Timeframe : 1 hour
Pivot points : price is over resistance 2
Type : Neutral
Timeframe : 1 hour
An analysis of the price chart with the Central Patterns scanner (detector of chart patterns and resistances and supports) shows a result that can have an impact on the price change:
Near resistance of channel
Type : Bearish
Timeframe : 1 hour
There is also a Japanese candlestick pattern detected by Central Candlesticks that could mark the end of the current short-term trend:
Doji
Type : Neutral
Timeframe : 1 hour
ProTrendLines
S3
S2
S1
R1
R2
R3
Price
| S3 | S2 | S1 | Price | R1 | R2 | R3 | |
|---|---|---|---|---|---|---|---|
| ProTrendLines | 19.99 | 20.85 | 21.39 | 22.30 | 22.40 | 23.25 | 24.26 |
| Change (%) | -10.36% | -6.50% | -4.08% | - | +0.45% | +4.26% | +8.79% |
| Change | -2.31 | -1.45 | -0.91 | - | +0.10 | +0.95 | +1.96 |
| Level | Intermediate | Intermediate | Major | - | Intermediate | Minor | Intermediate |
Pivot points can also be used to set your price objectives. Here is the price situation in relation to pivot points:
Daily
| Pivot points | S3 | S2 | S1 | PP | R1 | R2 | R3 |
|---|---|---|---|---|---|---|---|
| Standard | 21.30 | 21.50 | 21.80 | 22.00 | 22.30 | 22.50 | 22.80 |
| Camarilla | 21.96 | 22.01 | 22.05 | 22.10 | 22.15 | 22.19 | 22.24 |
| Woodie | 21.35 | 21.53 | 21.85 | 22.03 | 22.35 | 22.53 | 22.85 |
| Fibonacci | 21.50 | 21.69 | 21.81 | 22.00 | 22.19 | 22.31 | 22.50 |
Weekly
| Pivot points | S3 | S2 | S1 | PP | R1 | R2 | R3 |
|---|---|---|---|---|---|---|---|
| Standard | 19.32 | 19.88 | 20.77 | 21.33 | 22.22 | 22.78 | 23.67 |
| Camarilla | 21.25 | 21.38 | 21.52 | 21.65 | 21.78 | 21.92 | 22.05 |
| Woodie | 19.48 | 19.96 | 20.93 | 21.41 | 22.38 | 22.86 | 23.83 |
| Fibonacci | 19.88 | 20.44 | 20.78 | 21.33 | 21.89 | 22.23 | 22.78 |
Monthly
| Pivot points | S3 | S2 | S1 | PP | R1 | R2 | R3 |
|---|---|---|---|---|---|---|---|
| Standard | 9.85 | 13.81 | 16.67 | 20.63 | 23.49 | 27.45 | 30.31 |
| Camarilla | 17.65 | 18.27 | 18.90 | 19.52 | 20.15 | 20.77 | 21.40 |
| Woodie | 9.29 | 13.54 | 16.11 | 20.36 | 22.93 | 27.18 | 29.75 |
| Fibonacci | 13.81 | 16.42 | 18.03 | 20.63 | 23.24 | 24.85 | 27.45 |
Numerical data
The following are the details of the technical indicators and moving averages that were collected to generate this technical analysis:
Technical indicators
Moving averages
| RSI (14): | 66.12 | |
| MACD (12,26,9): | 0.2200 | |
| Directional Movement: | 21.80 | |
| AROON (14): | 71.43 | |
| DEMA (21): | 21.99 | |
| Parabolic SAR (0,02-0,02-0,2): | 21.11 | |
| Elder Ray (13): | 0.28 | |
| Super Trend (3,10): | 21.59 | |
| Zig ZAG (10): | 22.10 | |
| VORTEX (21): | 1.0500 | |
| Stochastique (14,3,5): | 91.12 | |
| TEMA (21): | 22.08 | |
| Williams %R (14): | -7.69 | |
| Chande Momentum Oscillator (20): | 1.00 | |
| Repulse (5,40,3): | 0.2100 | |
| ROCnROLL: | 1 | |
| TRIX (15,9): | 0.1000 | |
| Courbe Coppock: | 7.57 |
| MA7: | 21.44 | |
| MA20: | 20.61 | |
| MA50: | 21.98 | |
| MA100: | 21.30 | |
| MAexp7: | 22.00 | |
| MAexp20: | 21.73 | |
| MAexp50: | 21.38 | |
| MAexp100: | 21.08 | |
| Price / MA7: | +4.01% | |
| Price / MA20: | +8.20% | |
| Price / MA50: | +1.46% | |
| Price / MA100: | +4.69% | |
| Price / MAexp7: | +1.36% | |
| Price / MAexp20: | +2.62% | |
| Price / MAexp50: | +4.30% | |
| Price / MAexp100: | +5.79% |
Quotes :
-
15 min delayed data
-
Euronext Paris
News
The last news published on EXAIL TECHNOLOGIES at the time of the generation of this analysis was as follows:
- Exail Technologies announces the availability of its 2023 Universal Registration Document including the Annual Financial Report.
- 1st quarter 2024 activity: +16% revenue and +40% order intake
- Information on the SEA-1905 program for the Australian navy
- Visit of the Minister of Armed Forces to Exail, leader in autonomous robotic systems
- Record order for more than 1,000 units in Navigation