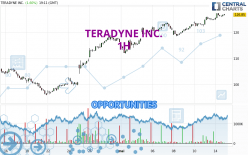
Londinia Opportunities Analyses - 05/14/2024 (GMT) TERADYNE INC. - 1H
I am delighted to see that my first price objective has been achieved. I hope you've taken advantage of it.
- U.S. Stocks
- Timeframe : 1H
- - Analysis generated on
- Status : TARGET REACHED
Summary of the analysis
Trends
Short term:
Strongly bullish
Underlying:
Strongly bullish
Technical indicators
83%
0%
17%
My opinion
Bullish above 124.23 USD
My targets
132.67 USD (+4.61%)
141.78 USD (+11.80%)
My analysis
All elements being clearly bullish, it would be possible for traders to trade only long positions (at the time of purchase) on TERADYNE INC. as long as the price remains well above 124.23 USD. The buyers' bullish objective is set at 132.67 USD. A bullish break in this resistance would boost the bullish momentum. The buyers could then target the resistance located at 141.78 USD. If there is any crossing, the next objective would be the resistance located at 166.87 USD. However, beware of bullish excesses that could lead to a possible short-term correction; but this possible correction would not be tradeable.
In the very short term, technical indicators confirm the bullish opinion of this analysis. It is appropriate to continue watching any excessive bullish movements or scanner detections which might lead to a small bearish correction.
Force
0
10
8.8

Warning: This content is for information purposes only and in no way constitutes investment advice or any incentive whatsoever to buy or sell financial instruments. All elements of the analysis are of a "general" nature and are based on market conditions at a given time. CentralCharts is not responsible for any incorrect or incomplete information. Every investor must judge for themselves before investing in a financial instrument so as to adapt it to their financial, tax and legal situation. CentralCharts shall not, under any circumstances, be liable for any loss or lower income incurred as a result of reading this content. Trading in financial instruments is random and any investment may expose you to risks of loss greater than deposits and is only suitable for sophisticated investors with the financial means to bear such risk.
Additional analysis
Quotes
The TERADYNE INC. rating is 126.82 USD. The price has increased by +1.58% since the last closing and was between 124.81 USD and 127.36 USD. This implies that the price is at +1.61% from its lowest and at -0.42% from its highest.124.81
127.36
126.82
A bearish opening was detected by the Central Gaps scanner. Sellers are trying to impose a bearish trend in the very short term.
Bearish opening
Type : Bearish
Timeframe : Openning
A study of price movements over other periods shows the following variations:
New HIGH record (1 year)
Type : Bullish
Timeframe : Weekly
New HIGH record (1st january)
Type : Bullish
Timeframe : Weekly
New HIGH record (1 month)
Type : Bullish
Timeframe : Weekly
Technical
A technical analysis in 1H of this TERADYNE INC. chart shows a strongly bullish trend. The signals given by the moving averages are 92.86% bullish. This strong bullish trend is confirmed by the strong signals currently being given by short-term moving averages. The Central Indicators market scanner currently does not detect any result that concerns moving averages.
Technical indicators are strongly bullish, suggesting that the price increase should continue.
But beware of excesses. The Central Indicators scanner currently detects this:
Williams %R indicator is overbought : over -20
Type : Neutral
Timeframe : 1 hour
Pivot points : price is over resistance 1
Type : Neutral
Timeframe : 1 hour
Pivot points : price is over resistance 1
Type : Neutral
Timeframe : Weekly
The Central Patterns scanner, which studies chart patterns, resistances and supports, has identified these signals:
Near horizontal support
Type : Bullish
Timeframe : 1 hour
Near support of channel
Type : Bullish
Timeframe : 1 hour
The Central Candlesticks scanner which studies Japanese candlesticks did not detect anything.
ProTrendLines
S3
S2
S1
R1
R2
R3
Price
| S3 | S2 | S1 | Price | R1 | R2 | R3 | |
|---|---|---|---|---|---|---|---|
| ProTrendLines | 110.93 | 116.82 | 124.23 | 126.82 | 132.67 | 141.78 | 166.87 |
| Change (%) | -12.53% | -7.89% | -2.04% | - | +4.61% | +11.80% | +31.58% |
| Change | -15.89 | -10.00 | -2.59 | - | +5.85 | +14.96 | +40.05 |
| Level | Major | Major | Major | - | Minor | Intermediate | Major |
Pivot points can also be used to set your price objectives. Here is the price situation in relation to pivot points:
Daily
| Pivot points | S3 | S2 | S1 | PP | R1 | R2 | R3 |
|---|---|---|---|---|---|---|---|
| Standard | 120.15 | 121.52 | 123.19 | 124.56 | 126.23 | 127.60 | 129.27 |
| Camarilla | 124.01 | 124.29 | 124.57 | 124.85 | 125.13 | 125.41 | 125.69 |
| Woodie | 120.29 | 121.60 | 123.33 | 124.64 | 126.37 | 127.68 | 129.41 |
| Fibonacci | 121.52 | 122.69 | 123.40 | 124.56 | 125.73 | 126.44 | 127.60 |
Weekly
| Pivot points | S3 | S2 | S1 | PP | R1 | R2 | R3 |
|---|---|---|---|---|---|---|---|
| Standard | 113.93 | 116.20 | 119.56 | 121.83 | 125.19 | 127.46 | 130.82 |
| Camarilla | 121.37 | 121.89 | 122.40 | 122.92 | 123.44 | 123.95 | 124.47 |
| Woodie | 114.48 | 116.47 | 120.11 | 122.10 | 125.74 | 127.73 | 131.37 |
| Fibonacci | 116.20 | 118.35 | 119.68 | 121.83 | 123.98 | 125.31 | 127.46 |
Monthly
| Pivot points | S3 | S2 | S1 | PP | R1 | R2 | R3 |
|---|---|---|---|---|---|---|---|
| Standard | 78.77 | 87.29 | 101.80 | 110.32 | 124.83 | 133.35 | 147.86 |
| Camarilla | 109.99 | 112.10 | 114.21 | 116.32 | 118.43 | 120.54 | 122.65 |
| Woodie | 81.78 | 88.79 | 104.81 | 111.82 | 127.84 | 134.85 | 150.87 |
| Fibonacci | 87.29 | 96.08 | 101.52 | 110.32 | 119.11 | 124.55 | 133.35 |
Numerical data
The following are the details of the technical indicators and moving averages that were collected to generate this technical analysis:
Technical indicators
Moving averages
| RSI (14): | 66.14 | |
| MACD (12,26,9): | 1.2800 | |
| Directional Movement: | 22.02 | |
| AROON (14): | 71.43 | |
| DEMA (21): | 126.51 | |
| Parabolic SAR (0,02-0,02-0,2): | 125.77 | |
| Elder Ray (13): | 0.90 | |
| Super Trend (3,10): | 124.14 | |
| Zig ZAG (10): | 126.51 | |
| VORTEX (21): | 1.1700 | |
| Stochastique (14,3,5): | 79.49 | |
| TEMA (21): | 126.75 | |
| Williams %R (14): | -15.43 | |
| Chande Momentum Oscillator (20): | 1.84 | |
| Repulse (5,40,3): | 0.5500 | |
| ROCnROLL: | 1 | |
| TRIX (15,9): | 0.1400 | |
| Courbe Coppock: | 4.42 |
| MA7: | 122.92 | |
| MA20: | 113.31 | |
| MA50: | 109.84 | |
| MA100: | 106.70 | |
| MAexp7: | 126.21 | |
| MAexp20: | 124.85 | |
| MAexp50: | 122.33 | |
| MAexp100: | 118.60 | |
| Price / MA7: | +3.17% | |
| Price / MA20: | +11.92% | |
| Price / MA50: | +15.46% | |
| Price / MA100: | +18.86% | |
| Price / MAexp7: | +0.48% | |
| Price / MAexp20: | +1.58% | |
| Price / MAexp50: | +3.67% | |
| Price / MAexp100: | +6.93% |
Quotes :
-
15 min delayed data
-
Actions NASDAQ
News
Don't forget to follow the news on TERADYNE INC.. At the time of publication of this analysis, the latest news was as follows:
- Teradyne Declares Quarterly Cash Dividend
- Teradyne Reports First Quarter 2024 Results
- Teradyne Honored as a 2024 VETS Indexes Recognized Employer
- Teradyne to Announce First Quarter 2024 Results
- Teradyne Robotics to bring the power of AI to robotics with NVIDIA