Londinia Opportunities Analyses - 05/14/2024 (GMT) TAYLOR MORRISON HOME - 1H
I am delighted to see that my first price objective has been achieved. I hope you've taken advantage of it.
- U.S. Stocks
- Timeframe : 1H
- - Analysis generated on
- Status : TARGET REACHED
Summary of the analysis
Trends
Short term:
Strongly bullish
Underlying:
Strongly bullish
Technical indicators
50%
22%
28%
My opinion
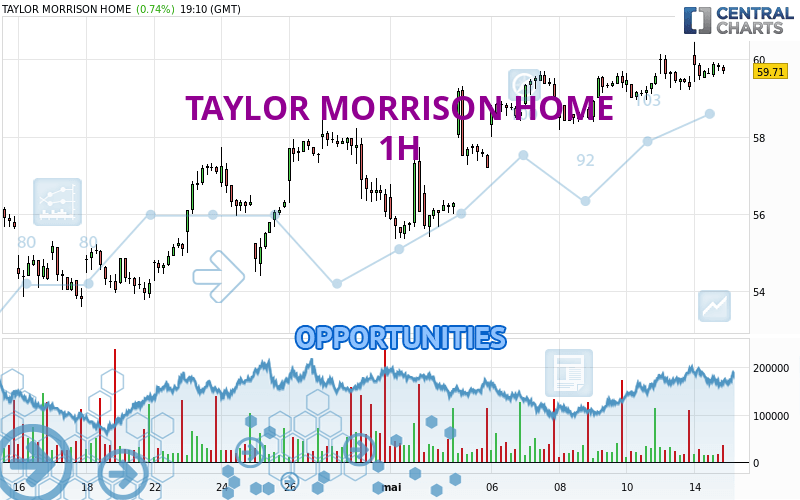
Bullish above 58.94 USD
My targets
60.82 USD (+1.71%)
62.17 USD (+3.96%)
My analysis
All elements being clearly bullish, it would be possible for traders to trade only long positions (at the time of purchase) on TAYLOR MORRISON HOME as long as the price remains well above 58.94 USD. The buyers' bullish objective is set at 60.82 USD. A bullish break in this resistance would boost the bullish momentum. The buyers could then target the resistance located at 62.17 USD. However, beware of bullish excesses that could lead to a possible short-term correction; but this possible correction would not be tradeable.
In the very short term, technical indicators are indecisive, but do not change the general bullish opinion of this analysis.
Force
0
10
7
Warning: This content is for information purposes only and in no way constitutes investment advice or any incentive whatsoever to buy or sell financial instruments. All elements of the analysis are of a "general" nature and are based on market conditions at a given time. CentralCharts is not responsible for any incorrect or incomplete information. Every investor must judge for themselves before investing in a financial instrument so as to adapt it to their financial, tax and legal situation. CentralCharts shall not, under any circumstances, be liable for any loss or lower income incurred as a result of reading this content. Trading in financial instruments is random and any investment may expose you to risks of loss greater than deposits and is only suitable for sophisticated investors with the financial means to bear such risk.
Additional analysis
Quotes
TAYLOR MORRISON HOME rating 59.80 USD. The price has increased by +0.89% since the last closing with the lowest point at 59.42 USD and the highest point at 60.45 USD. The deviation from the price is +0.64% for the low point and -1.08% for the high point.59.42
60.45
59.80
A study of price movements over other periods shows the following variations:
Near a new HIGH record (5 years)
Type : Bullish
Timeframe : Weekly
Near a new HIGH record (1 year)
Type : Bullish
Timeframe : Weekly
Near a new HIGH record (1st january)
Type : Bullish
Timeframe : Weekly
New HIGH record (1 month)
Type : Bullish
Timeframe : Weekly
Technical
Technical analysis of TAYLOR MORRISON HOME in 1H shows a strongly overall bullish trend. The signals given by the moving averages are 92.86% bullish. This strong bullish trend is confirmed by the strong signals currently being given by short-term moving averages. The Central Indicators scanner does not detect any result on moving averages that would impact this trend.
An assessment of technical indicators does not currently provide any relevant information on the direction of future price movements.
Central Indicators, the detector scanner for these technical indicators has recently detected several signals:
Momentum indicator is back under 0
Type : Bearish
Timeframe : 1 hour
Williams %R indicator is back under -50
Type : Bearish
Timeframe : 1 hour
Central Patterns, the scanner specializing in chart patterns, did not identify any signals.
The presence of a bearish pattern in Japanese candlesticks detected by Central Candlesticks that could cause a correction in the very short term was also detected:
Bearish harami
Type : Bearish
Timeframe : 1 hour
ProTrendLines
S3
S2
S1
R1
R2
Price
| S3 | S2 | S1 | Price | R1 | R2 | |
|---|---|---|---|---|---|---|
| ProTrendLines | 57.32 | 58.94 | 59.65 | 59.80 | 60.82 | 62.17 |
| Change (%) | -4.15% | -1.44% | -0.25% | - | +1.71% | +3.96% |
| Change | -2.48 | -0.86 | -0.15 | - | +1.02 | +2.37 |
| Level | Minor | Intermediate | Intermediate | - | Minor | Major |
Pivot points can also be used to set your price objectives. Here is the price situation in relation to pivot points:
Daily
| Pivot points | S3 | S2 | S1 | PP | R1 | R2 | R3 |
|---|---|---|---|---|---|---|---|
| Standard | 58.01 | 58.62 | 58.94 | 59.55 | 59.87 | 60.48 | 60.80 |
| Camarilla | 59.01 | 59.10 | 59.19 | 59.27 | 59.36 | 59.44 | 59.53 |
| Woodie | 57.88 | 58.55 | 58.81 | 59.48 | 59.74 | 60.41 | 60.67 |
| Fibonacci | 58.62 | 58.97 | 59.19 | 59.55 | 59.90 | 60.12 | 60.48 |
Weekly
| Pivot points | S3 | S2 | S1 | PP | R1 | R2 | R3 |
|---|---|---|---|---|---|---|---|
| Standard | 56.74 | 57.37 | 58.46 | 59.09 | 60.18 | 60.81 | 61.90 |
| Camarilla | 59.09 | 59.25 | 59.40 | 59.56 | 59.72 | 59.88 | 60.03 |
| Woodie | 56.98 | 57.49 | 58.70 | 59.21 | 60.42 | 60.93 | 62.14 |
| Fibonacci | 57.37 | 58.02 | 58.43 | 59.09 | 59.74 | 60.15 | 60.81 |
Monthly
| Pivot points | S3 | S2 | S1 | PP | R1 | R2 | R3 |
|---|---|---|---|---|---|---|---|
| Standard | 43.38 | 48.48 | 52.25 | 57.35 | 61.12 | 66.22 | 69.99 |
| Camarilla | 53.57 | 54.38 | 55.20 | 56.01 | 56.82 | 57.64 | 58.45 |
| Woodie | 42.71 | 48.15 | 51.58 | 57.02 | 60.45 | 65.89 | 69.32 |
| Fibonacci | 48.48 | 51.87 | 53.97 | 57.35 | 60.74 | 62.84 | 66.22 |
Numerical data
The following is the status of the technical indicators and moving averages at the time of publication of this technical analysis:
Technical indicators
Moving averages
| RSI (14): | 57.57 | |
| MACD (12,26,9): | 0.2100 | |
| Directional Movement: | 15.60 | |
| AROON (14): | 64.29 | |
| DEMA (21): | 59.81 | |
| Parabolic SAR (0,02-0,02-0,2): | 59.32 | |
| Elder Ray (13): | 0.20 | |
| Super Trend (3,10): | 58.77 | |
| Zig ZAG (10): | 59.76 | |
| VORTEX (21): | 1.0100 | |
| Stochastique (14,3,5): | 47.72 | |
| TEMA (21): | 59.72 | |
| Williams %R (14): | -60.16 | |
| Chande Momentum Oscillator (20): | -0.28 | |
| Repulse (5,40,3): | -0.1900 | |
| ROCnROLL: | 1 | |
| TRIX (15,9): | 0.0500 | |
| Courbe Coppock: | 0.98 |
| MA7: | 59.17 | |
| MA20: | 57.09 | |
| MA50: | 57.88 | |
| MA100: | 55.74 | |
| MAexp7: | 59.72 | |
| MAexp20: | 59.52 | |
| MAexp50: | 58.99 | |
| MAexp100: | 58.34 | |
| Price / MA7: | +1.06% | |
| Price / MA20: | +4.75% | |
| Price / MA50: | +3.32% | |
| Price / MA100: | +7.28% | |
| Price / MAexp7: | +0.13% | |
| Price / MAexp20: | +0.47% | |
| Price / MAexp50: | +1.37% | |
| Price / MAexp100: | +2.50% |
Quotes :
-
15 min delayed data
-
Actions NYSE
News
Don't forget to follow the news on TAYLOR MORRISON HOME. At the time of publication of this analysis, the latest news was as follows:
- Jaime Pou Named President of Taylor Morrison Atlanta Division
- Taylor Morrison Reports First Quarter 2024 Results
- Taylor Morrison Announces Date for First Quarter 2024 Earnings Release and Webcast Conference Call
- Taylor Morrison Ranked One of America's Most Responsible Companies by Newsweek
- Taylor Morrison Sees 185% Increase in Women in Construction Roles Since 2019