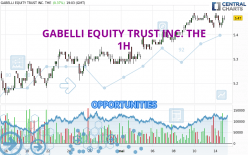
Londinia Opportunities Analyses - 05/14/2024 (GMT) GABELLI EQUITY TRUST INC. THE - 1H
- U.S. Stocks
- Timeframe : 1H
- - Analysis generated on
- Status : TARGET REACHED
Summary of the analysis

Additional analysis
Quotes
GABELLI EQUITY TRUST INC. THE rating 5.47 USD. On the day, this instrument gained +0.37% and was between 5.43 USD and 5.49 USD. This implies that the price is at +0.74% from its lowest and at -0.36% from its highest.A bullish opening was detected by the Central Gaps scanner. Buyers are trying to impose a bullish momentum in the very short term.
Bullish opening
Type : Bullish
Timeframe : Openning
A study of price movements over other periods shows the following variations:
Near a new HIGH record (1 year)
Type : Bullish
Timeframe : Weekly
Near a new HIGH record (1st january)
Type : Bullish
Timeframe : Weekly
Near a new HIGH record (1 month)
Type : Bullish
Timeframe : Weekly
Technical
A technical analysis in 1H of this GABELLI EQUITY TRUST INC. THE chart shows a strongly bullish trend. 89.29% of the signals given by moving averages are bullish. The slightly bullish signals given by the short-term moving averages indicate this trend is showing signs of running out of steam. The Central Indicators market scanner is currently detecting several bearish and bullish signals that could impact this trend:
Bearish trend reversal : Moving Average 20
Type : Bearish
Timeframe : 1 hour
Bearish trend reversal : adaptative moving average 20
Type : Bearish
Timeframe : 1 hour
Bullish price crossover with Moving Average 20
Type : Bullish
Timeframe : 1 hour
Bullish price crossover with adaptative moving average 20
Type : Bullish
Timeframe : 1 hour
An assessment of technical indicators shows a moderate bullish signal.
Central Indicators, the scanner specialised in technical indicators, has identified these signals:
RSI indicator is back over 50
Type : Bullish
Timeframe : 1 hour
Price is back over the pivot point
Type : Bullish
Timeframe : 1 hour
Williams %R indicator is back over -50
Type : Bullish
Timeframe : 1 hour
Central Patterns, the scanner specializing in chart patterns, did not identify any signals.
The Central Candlesticks scanner, specialised in Japanese candlesticks, did not identify any signals.
| S3 | S2 | S1 | Price | R1 | R2 | R3 | |
|---|---|---|---|---|---|---|---|
| ProTrendLines | 5.34 | 5.42 | 5.45 | 5.47 | 5.49 | 5.55 | 5.89 |
| Change (%) | -2.38% | -0.91% | -0.37% | - | +0.37% | +1.46% | +7.68% |
| Change | -0.13 | -0.05 | -0.02 | - | +0.02 | +0.08 | +0.42 |
| Level | Minor | Minor | Minor | - | Intermediate | Major | Minor |
Attention could also be paid to pivot points to set price objectives:
| Pivot points | S3 | S2 | S1 | PP | R1 | R2 | R3 |
|---|---|---|---|---|---|---|---|
| Standard | 5.36 | 5.40 | 5.42 | 5.46 | 5.48 | 5.52 | 5.54 |
| Camarilla | 5.43 | 5.44 | 5.45 | 5.45 | 5.46 | 5.46 | 5.47 |
| Woodie | 5.36 | 5.40 | 5.42 | 5.46 | 5.48 | 5.52 | 5.54 |
| Fibonacci | 5.40 | 5.42 | 5.43 | 5.46 | 5.48 | 5.49 | 5.52 |
| Pivot points | S3 | S2 | S1 | PP | R1 | R2 | R3 |
|---|---|---|---|---|---|---|---|
| Standard | 5.26 | 5.31 | 5.39 | 5.44 | 5.52 | 5.57 | 5.65 |
| Camarilla | 5.43 | 5.45 | 5.46 | 5.47 | 5.48 | 5.49 | 5.51 |
| Woodie | 5.28 | 5.32 | 5.41 | 5.45 | 5.54 | 5.58 | 5.67 |
| Fibonacci | 5.31 | 5.36 | 5.39 | 5.44 | 5.49 | 5.52 | 5.57 |
| Pivot points | S3 | S2 | S1 | PP | R1 | R2 | R3 |
|---|---|---|---|---|---|---|---|
| Standard | 4.74 | 4.94 | 5.12 | 5.32 | 5.50 | 5.70 | 5.88 |
| Camarilla | 5.19 | 5.22 | 5.26 | 5.29 | 5.33 | 5.36 | 5.40 |
| Woodie | 4.72 | 4.94 | 5.10 | 5.32 | 5.48 | 5.70 | 5.86 |
| Fibonacci | 4.94 | 5.09 | 5.18 | 5.32 | 5.47 | 5.56 | 5.70 |
Numerical data
The following are the details of the technical indicators and moving averages that were collected to generate this technical analysis:
| RSI (14): | 57.44 | |
| MACD (12,26,9): | 0.0100 | |
| Directional Movement: | 6.29 | |
| AROON (14): | -42.85 | |
| DEMA (21): | 5.47 | |
| Parabolic SAR (0,02-0,02-0,2): | 5.48 | |
| Elder Ray (13): | 0 | |
| Super Trend (3,10): | 5.49 | |
| Zig ZAG (10): | 5.47 | |
| VORTEX (21): | 0.9100 | |
| Stochastique (14,3,5): | 38.89 | |
| TEMA (21): | 5.46 | |
| Williams %R (14): | -25.00 | |
| Chande Momentum Oscillator (20): | 0.00 | |
| Repulse (5,40,3): | 0.5300 | |
| ROCnROLL: | 1 | |
| TRIX (15,9): | 0.0300 | |
| Courbe Coppock: | 0.52 |
| MA7: | 5.43 | |
| MA20: | 5.34 | |
| MA50: | 5.39 | |
| MA100: | 5.22 | |
| MAexp7: | 5.46 | |
| MAexp20: | 5.46 | |
| MAexp50: | 5.43 | |
| MAexp100: | 5.39 | |
| Price / MA7: | +0.74% | |
| Price / MA20: | +2.43% | |
| Price / MA50: | +1.48% | |
| Price / MA100: | +4.79% | |
| Price / MAexp7: | +0.18% | |
| Price / MAexp20: | +0.18% | |
| Price / MAexp50: | +0.74% | |
| Price / MAexp100: | +1.48% |
News
The latest news and videos published on GABELLI EQUITY TRUST INC. THE at the time of the analysis were as follows:
- Gabelli Equity Trust 10% Distribution Policy Reaffirmed And Declared First Quarter Distribution Of $0.15 Per Share
- Gabelli Equity Trust Extends Expiration Date of Tender Offer to January 5, 2024 for Series C and Series E Auction Rate Preferred Stock
- Gabelli Equity Trust Commences Tender Offer for Series C and Series E Auction Rate Preferred Stock
- Gabelli Equity Trust 10% Distribution Policy Reaffirmed and Declared Fourth Quarter Distribution of $0.15 Per Share
- Gabelli Equity Trust 10% Distribution Policy Reaffirmed and Declared Third Quarter Distribution of $0.15 Per Share