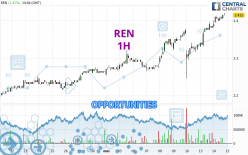
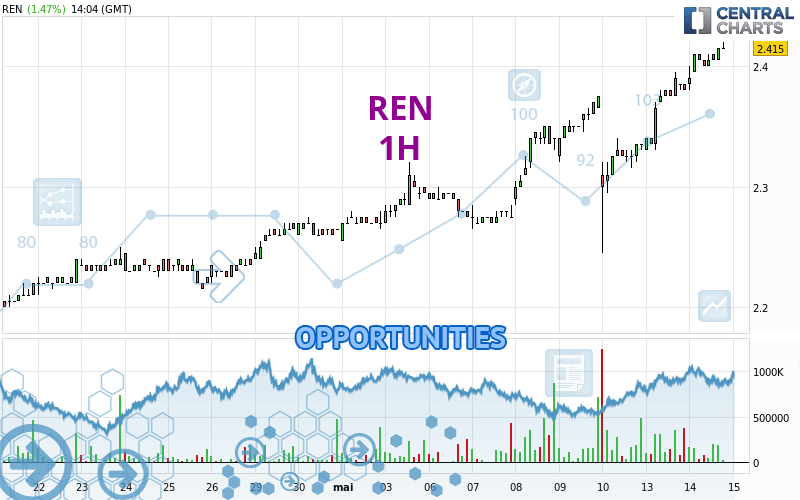
Londinia Opportunities Analyses - 05/14/2024 (GMT) REN - 1H
-
EUR
(-)
-
15 min delayed data - Euronext Lisbonne
| Type: | Stocks |
| Ticker: | RENE |
| ISIN: | PTREL0AM0008 |
I am delighted to see that my first price objective has been achieved. I hope you've taken advantage of it.
- Europe Stocks
- Timeframe : 1H
- - Analysis generated on
- Status : TARGET REACHED
Summary of the analysis
Trends
Short term:
Strongly bullish
Underlying:
Strongly bullish
Technical indicators
83%
0%
17%
My opinion
Bullish above 2.388 EUR
My targets
2.451 EUR (+1.49%)
2.498 EUR (+3.44%)
My analysis
REN is part of a very strong bullish trend. Traders may consider trading only long positions (at the time of purchase) as long as the price remains well above 2.388 EUR. The next resistance located at 2.451 EUR is the next bullish objective to be reached. A bullish break in this resistance would boost the bullish momentum. The bullish movement could then continue towards the next resistance located at 2.498 EUR. After this resistance, buyers could then target 2.583 EUR. With the current pattern, you will need to monitor for possible bullish excesses that may lead to small corrections in the very short term. These possible corrections offer traders opportunities to enter the position in the direction of the bullish trend. Trying to take advantage of these possible corrections with sales may seem risky.
In the very short term, the general bullish sentiment is confirmed by technical indicators. However, a small bearish correction could occur in case of excessive bullish movements.
Force
0
10
8.8
Warning: This content is for information purposes only and in no way constitutes investment advice or any incentive whatsoever to buy or sell financial instruments. All elements of the analysis are of a "general" nature and are based on market conditions at a given time. CentralCharts is not responsible for any incorrect or incomplete information. Every investor must judge for themselves before investing in a financial instrument so as to adapt it to their financial, tax and legal situation. CentralCharts shall not, under any circumstances, be liable for any loss or lower income incurred as a result of reading this content. Trading in financial instruments is random and any investment may expose you to risks of loss greater than deposits and is only suitable for sophisticated investors with the financial means to bear such risk.
Additional analysis
Quotes
The REN rating is 2.415 EUR. The price registered an increase of +1.47% on the session with the lowest point at 2.380 EUR and the highest point at 2.415 EUR. The deviation from the price is +1.47% for the low point and 0% for the high point.2.380
2.415
2.415
The Central Gaps scanner detects a bullish opening marking the presence of buyers ahead of sellers at the opening but not sufficiently marked to allow the price to register a quotation gap.
Bullish opening
Type : Bullish
Timeframe : Openning
So that you have an overall view of the price change, here is a table showing the variations over several periods:
Near a new HIGH record (1 year)
Type : Bullish
Timeframe : Weekly
New HIGH record (1st january)
Type : Bullish
Timeframe : Weekly
New HIGH record (1 month)
Type : Bullish
Timeframe : Weekly
The Central Volumes scanner detects abnormal volumes on the asset:
Abnormal volumes
Timeframe : 5 days
Technical
A technical analysis in 1H of this REN chart shows a strongly bullish trend. The signals given by the moving averages are 92.86% bullish. This strong bullish trend is confirmed by the strong signals currently being given by short-term moving averages. The Central Indicators market scanner currently does not detect any result that concerns moving averages.
Technical indicators are strongly bullish, suggesting that the price increase should continue.
But beware of excesses. The Central Indicators scanner currently detects this:
Williams %R indicator is overbought : over -20
Type : Neutral
Timeframe : 1 hour
Pivot points : price is over resistance 1
Type : Neutral
Timeframe : 1 hour
Pivot points : price is over resistance 1
Type : Neutral
Timeframe : Weekly
No signals are given by Central Patterns, a market scanner specialised in chart patterns, resistances and supports.
No result was found by the Central Candlesticks scanner on Japanese candlesticks.
ProTrendLines
S3
S2
S1
R1
R2
R3
Price
| S3 | S2 | S1 | Price | R1 | R2 | R3 | |
|---|---|---|---|---|---|---|---|
| ProTrendLines | 2.265 | 2.309 | 2.388 | 2.415 | 2.421 | 2.451 | 2.498 |
| Change (%) | -6.21% | -4.39% | -1.12% | - | +0.25% | +1.49% | +3.44% |
| Change | -0.150 | -0.106 | -0.027 | - | +0.006 | +0.036 | +0.083 |
| Level | Intermediate | Major | Intermediate | - | Intermediate | Minor | Minor |
To determine price objectives, it is also possible to use the pivot points. Here is the price position in relation to pivot points:
Daily
| Pivot points | S3 | S2 | S1 | PP | R1 | R2 | R3 |
|---|---|---|---|---|---|---|---|
| Standard | 2.277 | 2.303 | 2.342 | 2.368 | 2.407 | 2.433 | 2.472 |
| Camarilla | 2.362 | 2.368 | 2.374 | 2.380 | 2.386 | 2.392 | 2.398 |
| Woodie | 2.283 | 2.306 | 2.348 | 2.371 | 2.413 | 2.436 | 2.478 |
| Fibonacci | 2.303 | 2.328 | 2.344 | 2.368 | 2.393 | 2.409 | 2.433 |
Weekly
| Pivot points | S3 | S2 | S1 | PP | R1 | R2 | R3 |
|---|---|---|---|---|---|---|---|
| Standard | 2.132 | 2.188 | 2.262 | 2.318 | 2.392 | 2.448 | 2.522 |
| Camarilla | 2.299 | 2.311 | 2.323 | 2.335 | 2.347 | 2.359 | 2.371 |
| Woodie | 2.140 | 2.193 | 2.270 | 2.323 | 2.400 | 2.453 | 2.530 |
| Fibonacci | 2.188 | 2.238 | 2.269 | 2.318 | 2.368 | 2.399 | 2.448 |
Monthly
| Pivot points | S3 | S2 | S1 | PP | R1 | R2 | R3 |
|---|---|---|---|---|---|---|---|
| Standard | 2.093 | 2.132 | 2.198 | 2.237 | 2.303 | 2.342 | 2.408 |
| Camarilla | 2.236 | 2.246 | 2.255 | 2.265 | 2.275 | 2.284 | 2.294 |
| Woodie | 2.108 | 2.139 | 2.213 | 2.244 | 2.318 | 2.349 | 2.423 |
| Fibonacci | 2.132 | 2.172 | 2.197 | 2.237 | 2.277 | 2.302 | 2.342 |
Numerical data
The following is the status of technical indicators and moving averages registered at the time this technical analysis was created:
Technical indicators
Moving averages
| RSI (14): | 68.92 | |
| MACD (12,26,9): | 0.0200 | |
| Directional Movement: | 20.552 | |
| AROON (14): | 92.857 | |
| DEMA (21): | 2.406 | |
| Parabolic SAR (0,02-0,02-0,2): | 2.342 | |
| Elder Ray (13): | 0.019 | |
| Super Trend (3,10): | 2.375 | |
| Zig ZAG (10): | 2.410 | |
| VORTEX (21): | 1.2710 | |
| Stochastique (14,3,5): | 93.87 | |
| TEMA (21): | 2.412 | |
| Williams %R (14): | -5.88 | |
| Chande Momentum Oscillator (20): | 0.035 | |
| Repulse (5,40,3): | 0.0160 | |
| ROCnROLL: | 1 | |
| TRIX (15,9): | 0.1060 | |
| Courbe Coppock: | 5.09 |
| MA7: | 2.341 | |
| MA20: | 2.274 | |
| MA50: | 2.228 | |
| MA100: | 2.247 | |
| MAexp7: | 2.401 | |
| MAexp20: | 2.380 | |
| MAexp50: | 2.349 | |
| MAexp100: | 2.317 | |
| Price / MA7: | +3.16% | |
| Price / MA20: | +6.20% | |
| Price / MA50: | +8.39% | |
| Price / MA100: | +7.48% | |
| Price / MAexp7: | +0.58% | |
| Price / MAexp20: | +1.47% | |
| Price / MAexp50: | +2.81% | |
| Price / MAexp100: | +4.23% |
Quotes :
-
15 min delayed data
-
Euronext Lisbonne
News
The last news published on REN at the time of the generation of this analysis was as follows:
- ANNOUNCEMENT OF 2023 ANNUAL RESULTS OF TONG REN TANG TECHNOLOGIES
- Flash News: OKG Technology Chairman Jeff Ren Outlines the Future of Web3 at Economist Impact's Technology for Change Asia 2024
- Flash News: OKG Technology Chairman Jeff Ren to Speak at Economist Impact's Technology for Change Asia Event in Hong Kong
- Flash News: OKG Technology Chairman Jeff Ren to Speak at Economist Impact's Technology for Change Asia Event in Hong Kong
- Xinhua Silk Road: Pien Tze Huang, Beijing Tong Ren Tang agree to boost bilateral cooperation, promote high-quality development of TCM