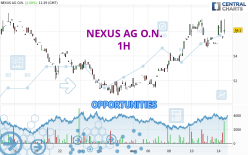
Londinia Opportunities Analyses - 05/14/2024 (GMT) NEXUS AG O.N. - 1H
| Type: | Stocks |
| Ticker: | NXU |
| ISIN: | DE0005220909 |
- Europe Stocks
- Timeframe : 1H
- - Analysis generated on
- Status : TARGET REACHED
Summary of the analysis

Additional analysis
Quotes
The NEXUS AG O.N. rating is 56.1 EUR. The price has increased by +2.00% since the last closing with the lowest point at 55.4 EUR and the highest point at 57.0 EUR. The deviation from the price is +1.26% for the low point and -1.58% for the high point.The Central Gaps scanner detects the formation of a bullish gap marking the strong presence of buyers against sellers at the opening. This formed a quotation gap.
Opening Gap UP
Type : Bullish
Timeframe : Openning
So that you have an overall view of the price change, here is a table showing the variations over several periods:
Near a new HIGH record (1 month)
Type : Bullish
Timeframe : Weekly
Technical
A technical analysis in 1H of this NEXUS AG O.N. chart shows a strongly bullish trend. The signals given by moving averages are 89.29% bullish. This strongly bullish trend seems to be running out of steam given the signals being given by short-term moving averages. The Central Indicators market scanner is currently detecting several bullish signals that could impact this trend:
Bullish price crossover with Moving Average 20
Type : Bullish
Timeframe : 1 hour
Bullish price crossover with adaptative moving average 20
Type : Bullish
Timeframe : 1 hour
An assessment of technical indicators shows a strong bullish signal.
Central Indicators, the detector scanner for these technical indicators has recently detected several signals:
Pivot points : price is over resistance 2
Type : Neutral
Timeframe : 1 hour
Aroon indicator bullish trend
Type : Bullish
Timeframe : 1 hour
Williams %R indicator is back over -50
Type : Bullish
Timeframe : 1 hour
The Central Patterns scanner, which studies chart patterns, resistances and supports, has identified this signal:
Near horizontal resistance
Type : Bearish
Timeframe : 1 hour
For a small rebound in the very short term, the Central Candlesticks scanner currently notes the presence of these bullish patterns in Japanese candlesticks:
Upside gap
Type : Bullish
Timeframe : 1 hour
Long white line
Type : Bullish
Timeframe : 1 hour
Abandoned baby morning star
Type : Bullish
Timeframe : 1 hour
| S3 | S2 | S1 | Price | R1 | R2 | R3 | |
|---|---|---|---|---|---|---|---|
| ProTrendLines | 52.1 | 53.7 | 55.3 | 56.1 | 56.2 | 57.0 | 57.6 |
| Change (%) | -7.13% | -4.28% | -1.43% | - | +0.18% | +1.60% | +2.67% |
| Change | -4.0 | -2.4 | -0.8 | - | +0.1 | +0.9 | +1.5 |
| Level | Intermediate | Minor | Major | - | Minor | Intermediate | Intermediate |
To determine price objectives, it is also possible to use the pivot points. Here is the price position in relation to pivot points:
| Pivot points | S3 | S2 | S1 | PP | R1 | R2 | R3 |
|---|---|---|---|---|---|---|---|
| Standard | 53.8 | 54.3 | 54.6 | 55.1 | 55.4 | 55.9 | 56.2 |
| Camarilla | 54.8 | 54.9 | 54.9 | 55.0 | 55.1 | 55.2 | 55.2 |
| Woodie | 53.8 | 54.3 | 54.6 | 55.1 | 55.4 | 55.9 | 56.2 |
| Fibonacci | 54.3 | 54.6 | 54.8 | 55.1 | 55.4 | 55.6 | 55.9 |
| Pivot points | S3 | S2 | S1 | PP | R1 | R2 | R3 |
|---|---|---|---|---|---|---|---|
| Standard | 46.8 | 49.1 | 52.4 | 54.7 | 58.0 | 60.3 | 63.6 |
| Camarilla | 54.2 | 54.7 | 55.2 | 55.7 | 56.2 | 56.7 | 57.2 |
| Woodie | 47.3 | 49.4 | 52.9 | 55.0 | 58.5 | 60.6 | 64.1 |
| Fibonacci | 49.1 | 51.2 | 52.6 | 54.7 | 56.8 | 58.2 | 60.3 |
| Pivot points | S3 | S2 | S1 | PP | R1 | R2 | R3 |
|---|---|---|---|---|---|---|---|
| Standard | 41.9 | 46.4 | 49.0 | 53.5 | 56.1 | 60.6 | 63.2 |
| Camarilla | 49.8 | 50.4 | 51.1 | 51.7 | 52.4 | 53.0 | 53.7 |
| Woodie | 41.1 | 45.9 | 48.2 | 53.0 | 55.3 | 60.1 | 62.4 |
| Fibonacci | 46.4 | 49.1 | 50.8 | 53.5 | 56.2 | 57.9 | 60.6 |
Numerical data
The following are the details of the technical indicators and moving averages that were collected to generate this technical analysis:
| RSI (14): | 57.20 | |
| MACD (12,26,9): | 0.3000 | |
| Directional Movement: | 36.8 | |
| AROON (14): | 78.6 | |
| DEMA (21): | 56.0 | |
| Parabolic SAR (0,02-0,02-0,2): | 54.9 | |
| Elder Ray (13): | 0.7 | |
| Super Trend (3,10): | 54.9 | |
| Zig ZAG (10): | 56.1 | |
| VORTEX (21): | 0.9000 | |
| Stochastique (14,3,5): | 51.30 | |
| TEMA (21): | 55.8 | |
| Williams %R (14): | -39.10 | |
| Chande Momentum Oscillator (20): | 1.3 | |
| Repulse (5,40,3): | -1.1000 | |
| ROCnROLL: | 1 | |
| TRIX (15,9): | 0.1000 | |
| Courbe Coppock: | 0.90 |
| MA7: | 54.7 | |
| MA20: | 53.6 | |
| MA50: | 55.4 | |
| MA100: | 56.7 | |
| MAexp7: | 55.8 | |
| MAexp20: | 55.6 | |
| MAexp50: | 54.8 | |
| MAexp100: | 54.3 | |
| Price / MA7: | +2.56% | |
| Price / MA20: | +4.66% | |
| Price / MA50: | +1.26% | |
| Price / MA100: | -1.06% | |
| Price / MAexp7: | +0.54% | |
| Price / MAexp20: | +0.90% | |
| Price / MAexp50: | +2.37% | |
| Price / MAexp100: | +3.31% |
News
Don't forget to follow the news on NEXUS AG O.N.. At the time of publication of this analysis, the latest news was as follows:
- Nexus Industrial REIT Announces May and June Distributions
- DADA DEADLINE: ROSEN, NATIONAL TRIAL LAWYERS, Encourages Dada Nexus Limited Investors With Losses in Excess of $100k to Secure Counsel Before Important March 11 Deadline in Securities Class Action First Filed by the Firm - DADA
- Nexus Pro Token Propels Gaming Industry into Blockchain Era with Seamless Integration
- SHAREHOLDER ALERT: Pomerantz Law Firm Announces the Filing of a Class Action Against Dada Nexus Limited - DADA
- Dada Nexus Limited Sued for Securities Law Violations - Investors Should Contact The Gross Law Firm for More Information - DADA