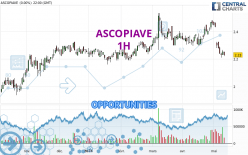
Londinia Opportunities Analyses - 05/14/2024 (GMT) ASCOPIAVE - 1H
-
EUR
(-)
-
15 min delayed data - Italy Stocks
| Type: | Stocks |
| Ticker: | ASC |
| ISIN: | IT0004093263 |
I am delighted to see that my first price objective has been achieved. I hope you've taken advantage of it.
- Europe Stocks
- Timeframe : 1H
- - Analysis generated on
- Status : TARGET REACHED
Summary of the analysis
Trends
Short term:
Strongly bearish
Underlying:
Strongly bearish
Technical indicators
22%
50%
28%
My opinion
Bearish under 2.246 EUR
My targets
2.210 EUR (-0.90%)
2.182 EUR (-2.15%)
My analysis
ASCOPIAVE is part of a very strong bearish trend. Traders may consider trading only short positions (for sale) as long as the price remains well below 2.246 EUR. The next support located at 2.210 EUR is the next bearish objective to target. A bearish break of this support would revive the bearish momentum. The bearish movement could then continue towards the next support located at 2.182 EUR. Below this support, sellers could then target 2.066 EUR. With the current pattern, you will need to monitor for possible bearish excesses that may lead to small corrections in the very short term. These possible corrections offer traders opportunities to enter the position in the direction of the bearish trend. Trying to profit from the purchase of these possible corrections may seem risky.
Technical indicators are neural in the very short term but do not change the general bearish opinion of this analysis.
Force
0
10
7

Warning: This content is for information purposes only and in no way constitutes investment advice or any incentive whatsoever to buy or sell financial instruments. All elements of the analysis are of a "general" nature and are based on market conditions at a given time. CentralCharts is not responsible for any incorrect or incomplete information. Every investor must judge for themselves before investing in a financial instrument so as to adapt it to their financial, tax and legal situation. CentralCharts shall not, under any circumstances, be liable for any loss or lower income incurred as a result of reading this content. Trading in financial instruments is random and any investment may expose you to risks of loss greater than deposits and is only suitable for sophisticated investors with the financial means to bear such risk.
Additional analysis
Quotes
The ASCOPIAVE rating is 2.230 EUR. The price registered an increase of +0.00% on the session and was between 2.220 EUR and 2.240 EUR. This implies that the price is at +0.45% from its lowest and at -0.45% from its highest.2.220
2.240
2.230
A bearish opening was detected by the Central Gaps scanner. Sellers are trying to impose a bearish trend in the very short term.
Bearish opening
Type : Bearish
Timeframe : Openning
A study of price movements over other periods shows the following variations:
Near a new HIGH record (1 month)
Type : Bullish
Timeframe : Weekly
Technical
A technical analysis in 1H of this ASCOPIAVE chart shows a sharp bearish trend. The signals given by moving averages are 92.86% bearish. This strong bearish trend is confirmed by the strong signals currently being given by short-term moving averages. The Central Indicators market scanner currently does not detect any result that concerns moving averages.
An assessment of technical indicators does not currently provide any relevant information on the direction of future price movements.
Central Indicators, the scanner specialised in technical indicators, has identified this signal:
Williams %R indicator is back under -50
Type : Bearish
Timeframe : 1 hour
The analysis of the price chart with Central Patterns scanners does not return any result.
No result was found by the Central Candlesticks scanner on Japanese candlesticks.
ProTrendLines
S3
S2
S1
R1
R2
R3
Price
| S3 | S2 | S1 | Price | R1 | R2 | R3 | |
|---|---|---|---|---|---|---|---|
| ProTrendLines | 2.066 | 2.182 | 2.210 | 2.230 | 2.246 | 2.265 | 2.309 |
| Change (%) | -7.35% | -2.15% | -0.90% | - | +0.72% | +1.57% | +3.54% |
| Change | -0.164 | -0.048 | -0.020 | - | +0.016 | +0.035 | +0.079 |
| Level | Intermediate | Major | Minor | - | Intermediate | Minor | Minor |
Pivot points can also be used to set your price objectives. Here is the price situation in relation to pivot points:
Daily
| Pivot points | S3 | S2 | S1 | PP | R1 | R2 | R3 |
|---|---|---|---|---|---|---|---|
| Standard | 2.180 | 2.200 | 2.215 | 2.235 | 2.250 | 2.270 | 2.285 |
| Camarilla | 2.220 | 2.224 | 2.227 | 2.230 | 2.233 | 2.236 | 2.240 |
| Woodie | 2.178 | 2.199 | 2.213 | 2.234 | 2.248 | 2.269 | 2.283 |
| Fibonacci | 2.200 | 2.213 | 2.222 | 2.235 | 2.248 | 2.257 | 2.270 |
Weekly
| Pivot points | S3 | S2 | S1 | PP | R1 | R2 | R3 |
|---|---|---|---|---|---|---|---|
| Standard | 2.087 | 2.148 | 2.202 | 2.263 | 2.317 | 2.378 | 2.432 |
| Camarilla | 2.223 | 2.234 | 2.245 | 2.255 | 2.266 | 2.276 | 2.287 |
| Woodie | 2.083 | 2.146 | 2.198 | 2.261 | 2.313 | 2.376 | 2.428 |
| Fibonacci | 2.148 | 2.192 | 2.219 | 2.263 | 2.307 | 2.334 | 2.378 |
Monthly
| Pivot points | S3 | S2 | S1 | PP | R1 | R2 | R3 |
|---|---|---|---|---|---|---|---|
| Standard | 2.035 | 2.099 | 2.209 | 2.273 | 2.383 | 2.447 | 2.557 |
| Camarilla | 2.271 | 2.287 | 2.303 | 2.319 | 2.335 | 2.351 | 2.367 |
| Woodie | 2.058 | 2.111 | 2.232 | 2.285 | 2.406 | 2.459 | 2.580 |
| Fibonacci | 2.099 | 2.166 | 2.207 | 2.273 | 2.340 | 2.381 | 2.447 |
Numerical data
The following is the status of technical indicators and moving averages registered at the time this technical analysis was created:
Technical indicators
Moving averages
| RSI (14): | 42.95 | |
| MACD (12,26,9): | -0.0060 | |
| Directional Movement: | -10.643 | |
| AROON (14): | -35.714 | |
| DEMA (21): | 2.231 | |
| Parabolic SAR (0,02-0,02-0,2): | 2.252 | |
| Elder Ray (13): | -0.007 | |
| Super Trend (3,10): | 2.271 | |
| Zig ZAG (10): | 2.230 | |
| VORTEX (21): | 0.9110 | |
| Stochastique (14,3,5): | 42.86 | |
| TEMA (21): | 2.234 | |
| Williams %R (14): | -57.14 | |
| Chande Momentum Oscillator (20): | -0.015 | |
| Repulse (5,40,3): | 1.0070 | |
| ROCnROLL: | -1 | |
| TRIX (15,9): | -0.0370 | |
| Courbe Coppock: | 1.24 |
| MA7: | 2.252 | |
| MA20: | 2.257 | |
| MA50: | 2.240 | |
| MA100: | 2.179 | |
| MAexp7: | 2.234 | |
| MAexp20: | 2.240 | |
| MAexp50: | 2.253 | |
| MAexp100: | 2.261 | |
| Price / MA7: | -0.98% | |
| Price / MA20: | -1.20% | |
| Price / MA50: | -0.45% | |
| Price / MA100: | +2.34% | |
| Price / MAexp7: | -0.18% | |
| Price / MAexp20: | -0.45% | |
| Price / MAexp50: | -1.02% | |
| Price / MAexp100: | -1.37% |
Quotes :
-
15 min delayed data
-
Actions Italie