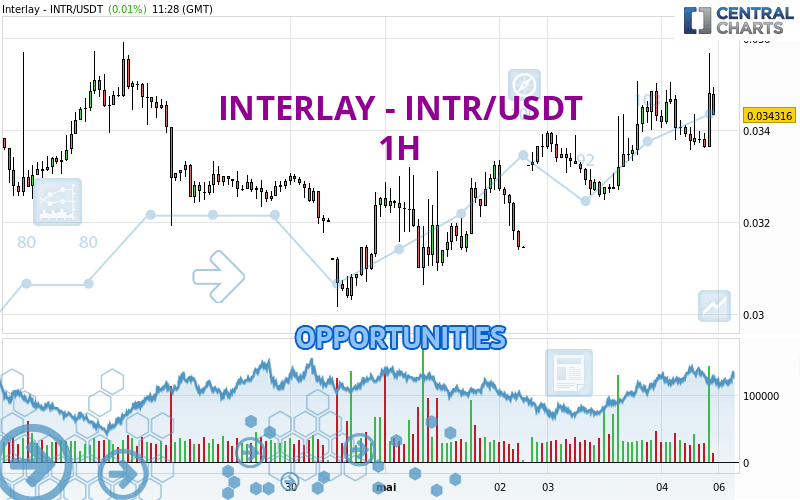
Londinia Opportunities Analyses - 05/04/2024 (GMT) INTERLAY - INTR/USDT - 1H
| Type: | Cryptocurrencies |
| Ticker: | INTRUSDT |
| ISIN: |
- Cryptocurrencies
- Timeframe : 1H
- - Analysis generated on
- Status : INVALID
Summary of the analysis
Trends
Short term:
Strongly bullish
Underlying:
Strongly bullish
Technical indicators
50%
17%
33%
My opinion
Bullish above 0.033957 USDT
My targets
0.035023 USDT (+1.94%)
0.035732 USDT (+4.01%)
My analysis
All elements being clearly bullish, it would be possible for traders to trade only long positions (at the time of purchase) on INTERLAY - INTR/USDT as long as the price remains well above 0.033957 USDT. The buyers' bullish objective is set at 0.035023 USDT. A bullish break in this resistance would boost the bullish momentum. The buyers could then target the resistance located at 0.035732 USDT. If there is any crossing, the next objective would be the resistance located at 0.038735 USDT. However, beware of bullish excesses that could lead to a possible short-term correction; but this possible correction would not be tradeable.
In the very short term, the general bullish sentiment is confirmed by technical indicators. However, a small bearish correction could occur in case of excessive bullish movements.
Force
0
10
7.1

Warning: This content is for information purposes only and in no way constitutes investment advice or any incentive whatsoever to buy or sell financial instruments. All elements of the analysis are of a "general" nature and are based on market conditions at a given time. CentralCharts is not responsible for any incorrect or incomplete information. Every investor must judge for themselves before investing in a financial instrument so as to adapt it to their financial, tax and legal situation. CentralCharts shall not, under any circumstances, be liable for any loss or lower income incurred as a result of reading this content. Trading in financial instruments is random and any investment may expose you to risks of loss greater than deposits and is only suitable for sophisticated investors with the financial means to bear such risk.
Additional analysis
Quotes
The INTERLAY - INTR/USDT price is 0.034356 USDT. The price registered an increase of +0.13% on the session and was traded between 0.033560 USDT and 0.035674 USDT over the period. The price is currently at +2.37% from its lowest and -3.69% from its highest.0.033560
0.035674
0.034356
A bearish opening was detected by the Central Gaps scanner. Sellers are trying to impose a bearish trend in the very short term.
Bearish opening
Type : Bearish
Timeframe : Openning
Here is a more detailed summary of the historical variations registered by INTERLAY - INTR/USDT:
Technical
Technical analysis of this 1H chart of INTERLAY - INTR/USDT indicates that the overall trend is strongly bullish. 92.86% of the signals given by moving averages are bullish. This strongly bullish trend is supported by the strong bullish signals given by short-term moving averages. The Central Indicators scanner detects a bullish signal on moving averages that could impact this trend:
Bullish trend reversal : adaptative moving average 20
Type : Bullish
Timeframe : 1 hour
Technical indicators are slightly bullish. There is therefore considerable uncertainty about the continuation of the increase.
Central Indicators, the scanner specialised in technical indicators, has identified these signals:
Price is back over the pivot point
Type : Bullish
Timeframe : 1 hour
Price is back over the pivot point
Type : Bullish
Timeframe : Weekly
Momentum indicator is back over 0
Type : Bullish
Timeframe : 1 hour
Williams %R indicator is back under -50
Type : Bearish
Timeframe : 1 hour
Central Patterns, the scanner specializing in chart patterns, did not identify any signals.
Central Candlesticks, the scanner specialised in Japanese candlesticks, detects these signals that could have an impact on the current short-term trend:
White line without lower shadow
Type : Bullish
Timeframe : 1 hour
Bearish harami
Type : Bearish
Timeframe : 1 hour
Long white line
Type : Bullish
Timeframe : 1 hour
Bearish harami cross
Type : Bearish
Timeframe : 1 hour
ProTrendLines
S3
S2
S1
R1
R2
R3
Price
| S3 | S2 | S1 | Price | R1 | R2 | R3 | |
|---|---|---|---|---|---|---|---|
| ProTrendLines | 0.030151 | 0.032295 | 0.033957 | 0.034356 | 0.035023 | 0.035732 | 0.038735 |
| Change (%) | -12.24% | -6.00% | -1.16% | - | +1.94% | +4.01% | +12.75% |
| Change | -0.004205 | -0.002061 | -0.000399 | - | +0.000667 | +0.001376 | +0.004379 |
| Level | Minor | Major | Intermediate | - | Minor | Intermediate | Minor |
To determine price objectives, it is also possible to use the pivot points. Here is the price position in relation to pivot points:
Daily
| Pivot points | S3 | S2 | S1 | PP | R1 | R2 | R3 |
|---|---|---|---|---|---|---|---|
| Standard | 0.030235 | 0.031351 | 0.032832 | 0.033948 | 0.035429 | 0.036545 | 0.038026 |
| Camarilla | 0.033598 | 0.033836 | 0.034074 | 0.034312 | 0.034550 | 0.034788 | 0.035026 |
| Woodie | 0.030417 | 0.031442 | 0.033014 | 0.034039 | 0.035611 | 0.036636 | 0.038208 |
| Fibonacci | 0.031351 | 0.032343 | 0.032956 | 0.033948 | 0.034940 | 0.035553 | 0.036545 |
Weekly
| Pivot points | S3 | S2 | S1 | PP | R1 | R2 | R3 |
|---|---|---|---|---|---|---|---|
| Standard | 0.021003 | 0.026188 | 0.029743 | 0.034928 | 0.038483 | 0.043668 | 0.047223 |
| Camarilla | 0.030895 | 0.031696 | 0.032497 | 0.033298 | 0.034099 | 0.034900 | 0.035702 |
| Woodie | 0.020188 | 0.025781 | 0.028928 | 0.034521 | 0.037668 | 0.043261 | 0.046408 |
| Fibonacci | 0.026188 | 0.029527 | 0.031589 | 0.034928 | 0.038267 | 0.040329 | 0.043668 |
Monthly
| Pivot points | S3 | S2 | S1 | PP | R1 | R2 | R3 |
|---|---|---|---|---|---|---|---|
| Standard | 0.007244 | 0.018698 | 0.025606 | 0.037060 | 0.043968 | 0.055422 | 0.062330 |
| Camarilla | 0.027466 | 0.029149 | 0.030832 | 0.032515 | 0.034198 | 0.035881 | 0.037565 |
| Woodie | 0.004972 | 0.017562 | 0.023334 | 0.035924 | 0.041696 | 0.054286 | 0.060058 |
| Fibonacci | 0.018698 | 0.025712 | 0.030045 | 0.037060 | 0.044074 | 0.048407 | 0.055422 |
Numerical data
The following is the status of technical indicators and moving averages registered at the time this technical analysis was created:
Technical indicators
Moving averages
| RSI (14): | 63.30 | |
| MACD (12,26,9): | 0.0003 | |
| Directional Movement: | 26.076572 | |
| AROON (14): | 28.571429 | |
| DEMA (21): | 0.034384 | |
| Parabolic SAR (0,02-0,02-0,2): | 0.033602 | |
| Elder Ray (13): | 0.000679 | |
| Super Trend (3,10): | 0.032891 | |
| Zig ZAG (10): | 0.034676 | |
| VORTEX (21): | 1.1245 | |
| Stochastique (14,3,5): | 35.69 | |
| TEMA (21): | 0.034311 | |
| Williams %R (14): | -53.60 | |
| Chande Momentum Oscillator (20): | 0.000229 | |
| Repulse (5,40,3): | -0.1090 | |
| ROCnROLL: | 1 | |
| TRIX (15,9): | 0.1215 | |
| Courbe Coppock: | 0.60 |
| MA7: | 0.033443 | |
| MA20: | 0.034904 | |
| MA50: | 0.042193 | |
| MA100: | 0.053870 | |
| MAexp7: | 0.034211 | |
| MAexp20: | 0.033929 | |
| MAexp50: | 0.033452 | |
| MAexp100: | 0.033197 | |
| Price / MA7: | +2.73% | |
| Price / MA20: | -1.57% | |
| Price / MA50: | -18.57% | |
| Price / MA100: | -36.22% | |
| Price / MAexp7: | +0.42% | |
| Price / MAexp20: | +1.26% | |
| Price / MAexp50: | +2.70% | |
| Price / MAexp100: | +3.49% |
Quotes :
-
Real time data
-
Cryptocompare