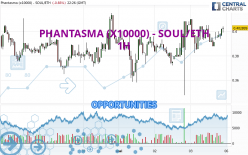
Londinia Opportunities Analyses - 05/03/2024 (GMT) PHANTASMA (X10000) - SOUL/ETH - 1H
| Type: | Cryptocurrencies |
| Ticker: | SOULETH |
| ISIN: |
- Cryptocurrencies
- Timeframe : 1H
- - Analysis generated on
- Status : INVALID
Summary of the analysis
Trends
Short term:
Strongly bullish
Underlying:
Strongly bullish
Technical indicators
72%
6%
22%
My opinion
Bullish above 0.395974 ETH
My targets
0.414920 ETH (+2.96%)
0.443904 ETH (+10.15%)
My analysis
All elements being clearly bullish, it would be possible for traders to trade only long positions (at the time of purchase) on PHANTASMA (X10000) - SOUL/ETH as long as the price remains well above 0.395974 ETH. The buyers' bullish objective is set at 0.414920 ETH. A bullish break in this resistance would boost the bullish momentum. The buyers could then target the resistance located at 0.443904 ETH. If there is any crossing, the next objective would be the resistance located at 0.468460 ETH. However, beware of bullish excesses that could lead to a possible short-term correction; but this possible correction would not be tradeable.
Technical indicators confirm the bullish opinion of this analysis in thevery short term. However, be careful of excessive bullish movements. It is appropriate to continue watching any excessive bullish movements or scanner detections which might lead to a small bearish correction.
Force
0
10
7.9

Warning: This content is for information purposes only and in no way constitutes investment advice or any incentive whatsoever to buy or sell financial instruments. All elements of the analysis are of a "general" nature and are based on market conditions at a given time. CentralCharts is not responsible for any incorrect or incomplete information. Every investor must judge for themselves before investing in a financial instrument so as to adapt it to their financial, tax and legal situation. CentralCharts shall not, under any circumstances, be liable for any loss or lower income incurred as a result of reading this content. Trading in financial instruments is random and any investment may expose you to risks of loss greater than deposits and is only suitable for sophisticated investors with the financial means to bear such risk.
Additional analysis
Quotes
The PHANTASMA (X10000) - SOUL/ETH rating is 0.403000 ETH. The price is lower by -0.61% since the last closing and was between 0.382202 ETH and 0.409800 ETH. This implies that the price is at +5.44% from its lowest and at -1.66% from its highest.0.382202
0.409800
0.403000
The Central Gaps scanner detects a bearish opening. A small advantage for sellers in the very short term.
Bearish opening
Type : Bearish
Timeframe : Openning
A study of price movements over other periods shows the following variations:
Technical
A technical analysis in 1H of this PHANTASMA (X10000) - SOUL/ETH chart shows a strongly bullish trend. 89.29% of the signals given by moving averages are bullish. This strongly bullish trend is supported by the strong bullish signals given by short-term moving averages. There is no crossing of moving average by the price or crossing of moving averages between themselves.
In fact, according to the parameters integrated into the Central Analyzer system, 13 technical indicators out of 18 analysed are currently bullish. Caution: the Central Indicators scanner currently detects an excess:
Williams %R indicator is overbought : over -20
Type : Neutral
Timeframe : 1 hour
An analysis of the price chart with the Central Patterns scanner (detector of chart patterns and resistances and supports) shows a result that can have an impact on the price change:
Near support of triangle
Type : Bullish
Timeframe : 1 hour
The presence of these Japanese chandelier patterns detected by Central Candlesticks that could impact the current short-term trend were also noted:
Doji
Type : Neutral
Timeframe : 1 hour
Bearish harami cross
Type : Bearish
Timeframe : 1 hour
ProTrendLines
S3
S2
S1
R1
R2
R3
Price
| S3 | S2 | S1 | Price | R1 | R2 | R3 | |
|---|---|---|---|---|---|---|---|
| ProTrendLines | 0.355780 | 0.374643 | 0.395974 | 0.403000 | 0.414920 | 0.443904 | 0.468460 |
| Change (%) | -11.72% | -7.04% | -1.74% | - | +2.96% | +10.15% | +16.24% |
| Change | -0.047220 | -0.028357 | -0.007026 | - | +0.011920 | +0.040904 | +0.065460 |
| Level | Major | Intermediate | Intermediate | - | Major | Minor | Minor |
Attention could also be paid to pivot points to set price objectives:
Daily
| Pivot points | S3 | S2 | S1 | PP | R1 | R2 | R3 |
|---|---|---|---|---|---|---|---|
| Standard | 0.305562 | 0.326611 | 0.366040 | 0.387089 | 0.426518 | 0.447567 | 0.486996 |
| Camarilla | 0.388839 | 0.394382 | 0.399926 | 0.405470 | 0.411014 | 0.416558 | 0.422102 |
| Woodie | 0.314753 | 0.331206 | 0.375231 | 0.391684 | 0.435709 | 0.452162 | 0.496187 |
| Fibonacci | 0.326611 | 0.349713 | 0.363986 | 0.387089 | 0.410191 | 0.424464 | 0.447567 |
Weekly
| Pivot points | S3 | S2 | S1 | PP | R1 | R2 | R3 |
|---|---|---|---|---|---|---|---|
| Standard | 0.237186 | 0.311160 | 0.352744 | 0.426718 | 0.468302 | 0.542276 | 0.583860 |
| Camarilla | 0.362551 | 0.373143 | 0.383736 | 0.394329 | 0.404922 | 0.415515 | 0.426108 |
| Woodie | 0.220992 | 0.303063 | 0.336550 | 0.418621 | 0.452108 | 0.534179 | 0.567666 |
| Fibonacci | 0.311160 | 0.355303 | 0.382575 | 0.426718 | 0.470861 | 0.498133 | 0.542276 |
Monthly
| Pivot points | S3 | S2 | S1 | PP | R1 | R2 | R3 |
|---|---|---|---|---|---|---|---|
| Standard | 0.101569 | 0.217206 | 0.303970 | 0.419607 | 0.506371 | 0.622008 | 0.708772 |
| Camarilla | 0.335074 | 0.353627 | 0.372181 | 0.390734 | 0.409287 | 0.427841 | 0.446394 |
| Woodie | 0.087133 | 0.209988 | 0.289534 | 0.412389 | 0.491935 | 0.614790 | 0.694336 |
| Fibonacci | 0.217206 | 0.294523 | 0.342290 | 0.419607 | 0.496924 | 0.544691 | 0.622008 |
Numerical data
The following are the details of the technical indicators and moving averages that were collected to generate this technical analysis:
Technical indicators
Moving averages
| RSI (14): | 56.36 | |
| MACD (12,26,9): | 0.0015 | |
| Directional Movement: | 0.130789 | |
| AROON (14): | -28.571429 | |
| DEMA (21): | 0.398305 | |
| Parabolic SAR (0,02-0,02-0,2): | 0.369957 | |
| Elder Ray (13): | 0.005017 | |
| Super Trend (3,10): | 0.382908 | |
| Zig ZAG (10): | 0.401999 | |
| VORTEX (21): | 1.0250 | |
| Stochastique (14,3,5): | 72.12 | |
| TEMA (21): | 0.398103 | |
| Williams %R (14): | -17.14 | |
| Chande Momentum Oscillator (20): | 0.001177 | |
| Repulse (5,40,3): | 1.0087 | |
| ROCnROLL: | 1 | |
| TRIX (15,9): | 0.0467 | |
| Courbe Coppock: | 0.66 |
| MA7: | 0.393173 | |
| MA20: | 0.425478 | |
| MA50: | 0.492967 | |
| MA100: | 0.488717 | |
| MAexp7: | 0.398123 | |
| MAexp20: | 0.395624 | |
| MAexp50: | 0.393277 | |
| MAexp100: | 0.393381 | |
| Price / MA7: | +2.50% | |
| Price / MA20: | -5.28% | |
| Price / MA50: | -18.25% | |
| Price / MA100: | -17.54% | |
| Price / MAexp7: | +1.22% | |
| Price / MAexp20: | +1.86% | |
| Price / MAexp50: | +2.47% | |
| Price / MAexp100: | +2.45% |
Quotes :
-
Real time data
-
Cryptocompare