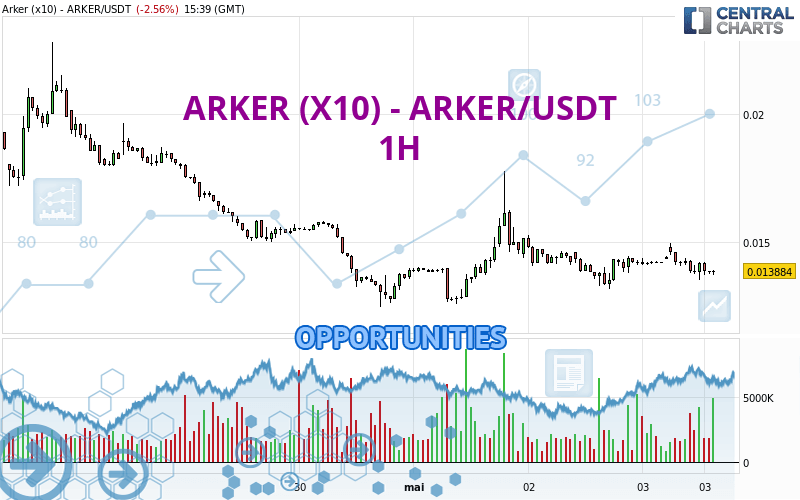
Londinia Opportunities Analyses - 05/03/2024 (GMT) ARKER (X10) - ARKER/USDT - 1H
| Type: | Cryptocurrencies |
| Ticker: | ARKERUSDT |
| ISIN: |
- Cryptocurrencies
- Timeframe : 1H
- - Analysis generated on
- Status : INVALID
Summary of the analysis
Trends
Short term:
Strongly bearish
Underlying:
Strongly bearish
Technical indicators
17%
67%
17%
My opinion
Bearish under 0.014050 USDT
My targets
0.013394 USDT (-3.49%)
0.012776 USDT (-7.95%)
My analysis
ARKER (X10) - ARKER/USDT is part of a very strong bearish trend. Traders may consider trading only short positions (for sale) as long as the price remains well below 0.014050 USDT. The next support located at 0.013394 USDT is the next bearish objective to target. A bearish break of this support would revive the bearish momentum. The bearish movement could then continue towards the next support located at 0.012776 USDT. Below this support, sellers could then target 0.008645 USDT. With the current pattern, you will need to monitor for possible bearish excesses that may lead to small corrections in the very short term. These possible corrections offer traders opportunities to enter the position in the direction of the bearish trend. Trying to profit from the purchase of these possible corrections may seem risky.
Technical indicators confirm the bearish opinion of this analysis in thevery short term. However, be careful of excessive bearish movements. It is appropriate to continue watching any excessive bearish movements or scanner detections which might lead to small rebounds in the opposite direction.
Force
0
10
7.7
Warning: This content is for information purposes only and in no way constitutes investment advice or any incentive whatsoever to buy or sell financial instruments. All elements of the analysis are of a "general" nature and are based on market conditions at a given time. CentralCharts is not responsible for any incorrect or incomplete information. Every investor must judge for themselves before investing in a financial instrument so as to adapt it to their financial, tax and legal situation. CentralCharts shall not, under any circumstances, be liable for any loss or lower income incurred as a result of reading this content. Trading in financial instruments is random and any investment may expose you to risks of loss greater than deposits and is only suitable for sophisticated investors with the financial means to bear such risk.
Additional analysis
Quotes
ARKER (X10) - ARKER/USDT rating 0.013879 USDT. The price is lower by -2.60% since the last closing and was between 0.013518 USDT and 0.014980 USDT. This implies that the price is at +2.67% from its lowest and at -7.35% from its highest.0.013518
0.014980
0.013879
A bearish opening was detected by the Central Gaps scanner. Sellers are trying to impose a bearish trend in the very short term.
Bearish opening
Type : Bearish
Timeframe : Openning
Here is a more detailed summary of the historical variations registered by ARKER (X10) - ARKER/USDT:
Technical
Technical analysis of this 1H chart of ARKER (X10) - ARKER/USDT indicates that the overall trend is strongly bearish. 92.86% of the signals given by moving averages are bearish. This strongly bearish trend is supported by the strong bearish signals given by short-term moving averages. The Central Indicators market scanner is currently detecting several bearish and bullish signals that could impact this trend:
Bearish trend reversal : Moving Average 20
Type : Bearish
Timeframe : 1 hour
Bullish price crossover with adaptative moving average 50
Type : Bullish
Timeframe : 1 hour
In fact, according to the parameters integrated into the Central Analyzer system, 12 technical indicators out of 18 analysed are currently bearish. Caution: the Central Indicators scanner currently detects an excess:
CCI indicator is oversold : under -100
Type : Neutral
Timeframe : 1 hour
Price is back under the pivot point
Type : Bearish
Timeframe : Weekly
An analysis of the price chart with the Central Patterns scanner (detector of chart patterns and resistances and supports) shows a result that can have an impact on the price change:
Near support of triangle
Type : Bullish
Timeframe : 1 hour
The Central Candlesticks scanner which studies Japanese candlesticks did not detect anything.
ProTrendLines
S2
S1
R1
R2
R3
Price
| S2 | S1 | Price | R1 | R2 | R3 | |
|---|---|---|---|---|---|---|
| ProTrendLines | 0.008645 | 0.012776 | 0.013879 | 0.014050 | 0.015832 | 0.017406 |
| Change (%) | -37.71% | -7.95% | - | +1.23% | +14.07% | +25.41% |
| Change | -0.005234 | -0.001103 | - | +0.000171 | +0.001953 | +0.003527 |
| Level | Minor | Major | - | Minor | Minor | Major |
Attention could also be paid to pivot points to set price objectives:
Daily
| Pivot points | S3 | S2 | S1 | PP | R1 | R2 | R3 |
|---|---|---|---|---|---|---|---|
| Standard | 0.011089 | 0.012133 | 0.013191 | 0.014235 | 0.015293 | 0.016337 | 0.017395 |
| Camarilla | 0.013671 | 0.013864 | 0.014056 | 0.014249 | 0.014442 | 0.014634 | 0.014827 |
| Woodie | 0.011096 | 0.012137 | 0.013198 | 0.014239 | 0.015300 | 0.016341 | 0.017402 |
| Fibonacci | 0.012133 | 0.012936 | 0.013432 | 0.014235 | 0.015038 | 0.015534 | 0.016337 |
Weekly
| Pivot points | S3 | S2 | S1 | PP | R1 | R2 | R3 |
|---|---|---|---|---|---|---|---|
| Standard | 0.002088 | 0.006893 | 0.013394 | 0.018199 | 0.024700 | 0.029505 | 0.036006 |
| Camarilla | 0.016787 | 0.017823 | 0.018860 | 0.019896 | 0.020932 | 0.021969 | 0.023005 |
| Woodie | 0.002937 | 0.007317 | 0.014243 | 0.018623 | 0.025549 | 0.029929 | 0.036855 |
| Fibonacci | 0.006893 | 0.011212 | 0.013880 | 0.018199 | 0.022518 | 0.025186 | 0.029505 |
Monthly
| Pivot points | S3 | S2 | S1 | PP | R1 | R2 | R3 |
|---|---|---|---|---|---|---|---|
| Standard | -0.003551 | 0.003580 | 0.008742 | 0.015873 | 0.021035 | 0.028166 | 0.033328 |
| Camarilla | 0.010524 | 0.011651 | 0.012778 | 0.013905 | 0.015032 | 0.016159 | 0.017286 |
| Woodie | -0.004535 | 0.003088 | 0.007759 | 0.015381 | 0.020052 | 0.027674 | 0.032345 |
| Fibonacci | 0.003580 | 0.008276 | 0.011177 | 0.015873 | 0.020569 | 0.023470 | 0.028166 |
Numerical data
The following are the details of the technical indicators and moving averages that were collected to generate this technical analysis:
Technical indicators
Moving averages
| RSI (14): | 42.76 | |
| MACD (12,26,9): | -0.0001 | |
| Directional Movement: | -4.728357 | |
| AROON (14): | -42.857143 | |
| DEMA (21): | 0.013983 | |
| Parabolic SAR (0,02-0,02-0,2): | 0.014894 | |
| Elder Ray (13): | -0.000230 | |
| Super Trend (3,10): | 0.014836 | |
| Zig ZAG (10): | 0.013742 | |
| VORTEX (21): | 0.9894 | |
| Stochastique (14,3,5): | 20.66 | |
| TEMA (21): | 0.013927 | |
| Williams %R (14): | -84.40 | |
| Chande Momentum Oscillator (20): | -0.000350 | |
| Repulse (5,40,3): | 0.1561 | |
| ROCnROLL: | 2 | |
| TRIX (15,9): | -0.0312 | |
| Courbe Coppock: | 2.87 |
| MA7: | 0.015805 | |
| MA20: | 0.015315 | |
| MA50: | 0.018269 | |
| MA100: | 0.015200 | |
| MAexp7: | 0.013977 | |
| MAexp20: | 0.014074 | |
| MAexp50: | 0.014220 | |
| MAexp100: | 0.014650 | |
| Price / MA7: | -12.19% | |
| Price / MA20: | -9.38% | |
| Price / MA50: | -24.03% | |
| Price / MA100: | -8.69% | |
| Price / MAexp7: | -0.70% | |
| Price / MAexp20: | -1.39% | |
| Price / MAexp50: | -2.40% | |
| Price / MAexp100: | -5.26% |
Quotes :
-
Real time data
-
Cryptocompare