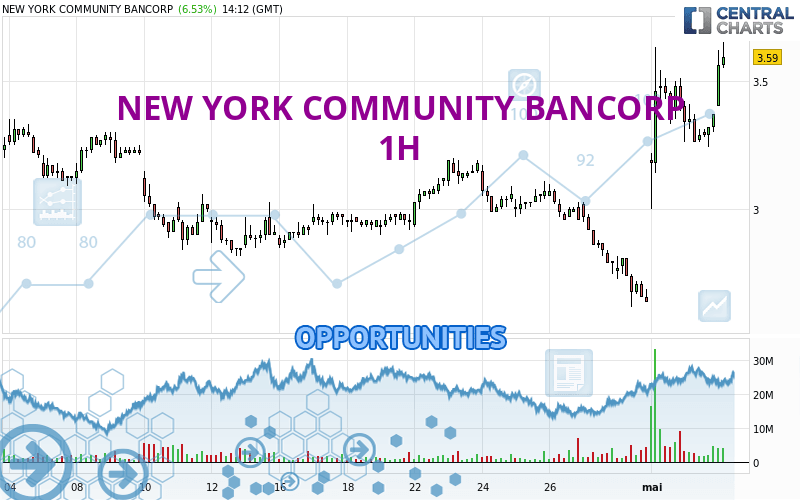
Londinia Opportunities Analyses - 05/03/2024 (GMT) NEW YORK COMMUNITY BANCORP - 1H
- U.S. Stocks
- Timeframe : 1H
- - Analysis generated on
- Status : INVALID
Summary of the analysis
Trends
Short term:
Strongly bullish
Underlying:
Strongly bullish
Technical indicators
83%
0%
17%
My opinion
Bullish above 3.51 USD
My targets
3.86 USD (+6.55%)
4.86 USD (+34.25%)
My analysis
NEW YORK COMMUNITY BANCORP is part of a very strong bullish trend. Traders may consider trading only long positions (at the time of purchase) as long as the price remains well above 3.51 USD. The next resistance located at 3.86 USD is the next bullish objective to be reached. A bullish break in this resistance would boost the bullish momentum. The bullish movement could then continue towards the next resistance located at 4.86 USD. After this resistance, buyers could then target 6.42 USD. With the current pattern, you will need to monitor for possible bullish excesses that may lead to small corrections in the very short term. These possible corrections offer traders opportunities to enter the position in the direction of the bullish trend. Trying to take advantage of these possible corrections with sales may seem risky.
In the very short term, the general bullish sentiment is confirmed by technical indicators. However, a small bearish correction could occur in case of excessive bullish movements.
Force
0
10
8.8

Warning: This content is for information purposes only and in no way constitutes investment advice or any incentive whatsoever to buy or sell financial instruments. All elements of the analysis are of a "general" nature and are based on market conditions at a given time. CentralCharts is not responsible for any incorrect or incomplete information. Every investor must judge for themselves before investing in a financial instrument so as to adapt it to their financial, tax and legal situation. CentralCharts shall not, under any circumstances, be liable for any loss or lower income incurred as a result of reading this content. Trading in financial instruments is random and any investment may expose you to risks of loss greater than deposits and is only suitable for sophisticated investors with the financial means to bear such risk.
Additional analysis
Quotes
The NEW YORK COMMUNITY BANCORP price is 3.62 USD. On the day, this instrument gained +7.42% and was between 3.40 USD and 3.62 USD. This implies that the price is at +6.47% from its lowest and at 0% from its highest.3.40
3.62
3.62
The Central Gaps scanner detects a bullish opening marking the presence of buyers ahead of sellers at the opening but not sufficiently marked to allow the price to register a quotation gap.
Bullish opening
Type : Bullish
Timeframe : Openning
Here is a more detailed summary of the historical variations registered by NEW YORK COMMUNITY BANCORP:
Abnormal volumes
Timeframe : 50 days
Technical
Technical analysis of this 1H chart of NEW YORK COMMUNITY BANCORP indicates that the overall trend is strongly bullish. 92.86% of the signals given by moving averages are bullish. This strongly bullish trend is supported by the strong bullish signals given by short-term moving averages. The Central Indicators scanner does not detect any result on moving averages that would impact this trend.
In fact, 15 technical indicators on 18 studied are currently positioned bullish. Caution: the Central Indicators scanner currently detects an excess:
Williams %R indicator is overbought : over -20
Type : Neutral
Timeframe : 1 hour
Pivot points : price is over resistance 2
Type : Neutral
Timeframe : 1 hour
Pivot points : price is over resistance 3
Type : Neutral
Timeframe : Weekly
Momentum indicator is back over 0
Type : Bullish
Timeframe : 1 hour
The analysis of the price chart with Central Patterns scanners does not return any result.
The Central Candlesticks scanner which studies Japanese candlesticks did not detect anything.
ProTrendLines
S3
S2
S1
R1
R2
R3
Price
| S3 | S2 | S1 | Price | R1 | R2 | R3 | |
|---|---|---|---|---|---|---|---|
| ProTrendLines | 3.20 | 3.41 | 3.51 | 3.62 | 3.63 | 4.86 | 6.42 |
| Change (%) | -11.60% | -5.80% | -3.04% | - | +0.28% | +34.25% | +77.35% |
| Change | -0.42 | -0.21 | -0.11 | - | +0.01 | +1.24 | +2.80 |
| Level | Intermediate | Minor | Minor | - | Major | Minor | Intermediate |
Pivot points can also be used to set your price objectives. Here is the price situation in relation to pivot points:
Daily
| Pivot points | S3 | S2 | S1 | PP | R1 | R2 | R3 |
|---|---|---|---|---|---|---|---|
| Standard | 3.09 | 3.16 | 3.27 | 3.34 | 3.45 | 3.52 | 3.63 |
| Camarilla | 3.32 | 3.34 | 3.35 | 3.37 | 3.39 | 3.40 | 3.42 |
| Woodie | 3.10 | 3.17 | 3.28 | 3.35 | 3.46 | 3.53 | 3.64 |
| Fibonacci | 3.16 | 3.23 | 3.28 | 3.34 | 3.41 | 3.46 | 3.52 |
Weekly
| Pivot points | S3 | S2 | S1 | PP | R1 | R2 | R3 |
|---|---|---|---|---|---|---|---|
| Standard | 2.60 | 2.76 | 2.87 | 3.03 | 3.14 | 3.30 | 3.41 |
| Camarilla | 2.90 | 2.92 | 2.95 | 2.97 | 3.00 | 3.02 | 3.04 |
| Woodie | 2.57 | 2.75 | 2.84 | 3.02 | 3.11 | 3.29 | 3.38 |
| Fibonacci | 2.76 | 2.87 | 2.93 | 3.03 | 3.14 | 3.20 | 3.30 |
Monthly
| Pivot points | S3 | S2 | S1 | PP | R1 | R2 | R3 |
|---|---|---|---|---|---|---|---|
| Standard | 1.67 | 2.14 | 2.40 | 2.87 | 3.13 | 3.60 | 3.86 |
| Camarilla | 2.45 | 2.52 | 2.58 | 2.65 | 2.72 | 2.78 | 2.85 |
| Woodie | 1.56 | 2.09 | 2.29 | 2.82 | 3.02 | 3.55 | 3.75 |
| Fibonacci | 2.14 | 2.42 | 2.59 | 2.87 | 3.15 | 3.32 | 3.60 |
Numerical data
The following are the details of the technical indicators and moving averages that were collected to generate this technical analysis:
Technical indicators
Moving averages
| RSI (14): | 69.33 | |
| MACD (12,26,9): | 0.1200 | |
| Directional Movement: | 24.42 | |
| AROON (14): | 7.14 | |
| DEMA (21): | 3.39 | |
| Parabolic SAR (0,02-0,02-0,2): | 3.04 | |
| Elder Ray (13): | 0.20 | |
| Super Trend (3,10): | 3.14 | |
| Zig ZAG (10): | 3.54 | |
| VORTEX (21): | 1.1000 | |
| Stochastique (14,3,5): | 70.05 | |
| TEMA (21): | 3.48 | |
| Williams %R (14): | -14.41 | |
| Chande Momentum Oscillator (20): | 0.08 | |
| Repulse (5,40,3): | 6.5200 | |
| ROCnROLL: | 1 | |
| TRIX (15,9): | 0.5000 | |
| Courbe Coppock: | 29.69 |
| MA7: | 3.12 | |
| MA20: | 3.06 | |
| MA50: | 3.38 | |
| MA100: | 5.94 | |
| MAexp7: | 3.43 | |
| MAexp20: | 3.25 | |
| MAexp50: | 3.12 | |
| MAexp100: | 3.09 | |
| Price / MA7: | +16.03% | |
| Price / MA20: | +18.30% | |
| Price / MA50: | +7.10% | |
| Price / MA100: | -39.06% | |
| Price / MAexp7: | +5.54% | |
| Price / MAexp20: | +11.38% | |
| Price / MAexp50: | +16.03% | |
| Price / MAexp100: | +17.15% |
Quotes :
-
15 min delayed data
-
Actions NYSE
News
The last news published on NEW YORK COMMUNITY BANCORP at the time of the generation of this analysis was as follows:
- ONGOING INVESTIGATION ALTER: The Schall Law Firm Announces it is Investigating Claims Against Flagstar Bancorp, Inc. and Encourages Investors with Losses to Contact the Firm
- Investor Network: New York Community Bancorp, Inc. to Host Earnings Call
-
 New York Community Bcp
- New York Community Bancorp, Inc. And Astoria Financial Corporation Announce The Termination Of Their Definitive Merger Agreement Effective January 1, 2017
-
New York Community Bcp