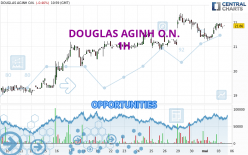
Londinia Opportunities Analyses - 05/03/2024 (GMT) DOUGLAS AGINH O.N. - 1H
-
EUR
(-)
-
15 min delayed data - Germany Stocks
| Type: | Stocks |
| Ticker: | DOU |
| ISIN: | DE000BEAU7Y1 |
- Europe Stocks
- Timeframe : 1H
- - Analysis generated on
- Status : INVALID
Summary of the analysis
Trends
Short term:
Bullish
Underlying:
Strongly bullish
Technical indicators
83%
6%
11%
My opinion
Bullish above 21.68 EUR
My targets
22.00 EUR (+0.82%)
22.38 EUR (+2.57%)
My analysis
All elements being clearly bullish, it would be possible for traders to trade only long positions (at the time of purchase) on DOUGLAS AGINH O.N. as long as the price remains well above 21.68 EUR. The buyers' bullish objective is set at 22.00 EUR. A bullish break in this resistance would boost the bullish momentum. The buyers could then target the resistance located at 22.38 EUR. Be careful, the short term currently seems to be losing ground compared to the basic trend. Longer time units should be analysed to identify possible overbought items that could be a sign of a possible short-term correction.
In the very short term, the general bullish sentiment is confirmed by technical indicators. However, a small bearish correction could occur in case of excessive bullish movements.
Force
0
10
7.9

Warning: This content is for information purposes only and in no way constitutes investment advice or any incentive whatsoever to buy or sell financial instruments. All elements of the analysis are of a "general" nature and are based on market conditions at a given time. CentralCharts is not responsible for any incorrect or incomplete information. Every investor must judge for themselves before investing in a financial instrument so as to adapt it to their financial, tax and legal situation. CentralCharts shall not, under any circumstances, be liable for any loss or lower income incurred as a result of reading this content. Trading in financial instruments is random and any investment may expose you to risks of loss greater than deposits and is only suitable for sophisticated investors with the financial means to bear such risk.
Additional analysis
Quotes
DOUGLAS AGINH O.N. rating 21.82 EUR. The price is lower by -0.64% since the last closing and was between 21.74 EUR and 21.96 EUR. This implies that the price is at +0.37% from its lowest and at -0.64% from its highest.21.74
21.96
21.82
A bearish opening was detected by the Central Gaps scanner. Sellers are trying to impose a bearish trend in the very short term.
Bearish opening
Type : Bearish
Timeframe : Openning
So that you have an overall view of the price change, here is a table showing the variations over several periods:
Near a new HIGH record (1 month)
Type : Bullish
Timeframe : Weekly
The Central Volumes scanner detects abnormal volumes on the asset:
Abnormal volumes
Timeframe : 50 days
Technical
Technical analysis of DOUGLAS AGINH O.N. in 1H shows a strongly overall bullish trend. 89.29% of the signals given by moving averages are bullish. The slightly bullish signals given by the short-term moving averages indicate this trend is showing signs of running out of steam. There is no crossing of moving average by the price or crossing of moving averages between themselves.
In fact, 15 technical indicators on 18 studied are currently bullish. Caution: the Central Indicators scanner currently detects an excess:
Williams %R indicator is overbought : over -20
Type : Neutral
Timeframe : 1 hour
Pivot points : price is over resistance 1
Type : Neutral
Timeframe : Weekly
The Central Patterns scanner, which studies chart patterns, resistances and supports, has identified these signals:
Near resistance of channel
Type : Bearish
Timeframe : 1 hour
Near horizontal support
Type : Bullish
Timeframe : 1 hour
The Central Candlesticks scanner which studies Japanese candlesticks did not detect anything.
ProTrendLines
S3
S2
S1
R1
R2
Price
| S3 | S2 | S1 | Price | R1 | R2 | |
|---|---|---|---|---|---|---|
| ProTrendLines | 20.00 | 21.21 | 21.68 | 21.82 | 22.00 | 22.38 |
| Change (%) | -8.34% | -2.80% | -0.64% | - | +0.82% | +2.57% |
| Change | -1.82 | -0.61 | -0.14 | - | +0.18 | +0.56 |
| Level | Minor | Major | Minor | - | Minor | Intermediate |
Pivot points can also be used to set your price objectives. Here is the price situation in relation to pivot points:
Daily
| Pivot points | S3 | S2 | S1 | PP | R1 | R2 | R3 |
|---|---|---|---|---|---|---|---|
| Standard | 20.76 | 21.00 | 21.48 | 21.72 | 22.20 | 22.44 | 22.92 |
| Camarilla | 21.76 | 21.83 | 21.89 | 21.96 | 22.03 | 22.09 | 22.16 |
| Woodie | 20.88 | 21.06 | 21.60 | 21.78 | 22.32 | 22.50 | 23.04 |
| Fibonacci | 21.00 | 21.28 | 21.45 | 21.72 | 22.00 | 22.17 | 22.44 |
Weekly
| Pivot points | S3 | S2 | S1 | PP | R1 | R2 | R3 |
|---|---|---|---|---|---|---|---|
| Standard | 19.91 | 20.39 | 20.73 | 21.21 | 21.55 | 22.03 | 22.37 |
| Camarilla | 20.86 | 20.93 | 21.01 | 21.08 | 21.16 | 21.23 | 21.31 |
| Woodie | 19.85 | 20.36 | 20.67 | 21.18 | 21.49 | 22.00 | 22.31 |
| Fibonacci | 20.39 | 20.70 | 20.89 | 21.21 | 21.52 | 21.71 | 22.03 |
Monthly
| Pivot points | S3 | S2 | S1 | PP | R1 | R2 | R3 |
|---|---|---|---|---|---|---|---|
| Standard | 16.09 | 17.53 | 19.51 | 20.95 | 22.93 | 24.37 | 26.35 |
| Camarilla | 20.56 | 20.87 | 21.19 | 21.50 | 21.81 | 22.13 | 22.44 |
| Woodie | 16.37 | 17.67 | 19.79 | 21.09 | 23.21 | 24.51 | 26.63 |
| Fibonacci | 17.53 | 18.83 | 19.64 | 20.95 | 22.25 | 23.06 | 24.37 |
Numerical data
The following is the status of the technical indicators and moving averages at the time of publication of this technical analysis:
Technical indicators
Moving averages
| RSI (14): | 55.25 | |
| MACD (12,26,9): | 0.0600 | |
| Directional Movement: | 8.18 | |
| AROON (14): | 42.86 | |
| DEMA (21): | 21.77 | |
| Parabolic SAR (0,02-0,02-0,2): | 21.36 | |
| Elder Ray (13): | 0.08 | |
| Super Trend (3,10): | 21.99 | |
| Zig ZAG (10): | 21.82 | |
| VORTEX (21): | 0.9700 | |
| Stochastique (14,3,5): | 85.19 | |
| TEMA (21): | 21.76 | |
| Williams %R (14): | -19.44 | |
| Chande Momentum Oscillator (20): | 0.38 | |
| Repulse (5,40,3): | -0.1700 | |
| ROCnROLL: | 1 | |
| TRIX (15,9): | 0.0200 | |
| Courbe Coppock: | 1.65 |
| MA7: | 21.54 | |
| MA20: | 20.64 | |
| MA50: | 0.00 | |
| MA100: | 0.00 | |
| MAexp7: | 21.76 | |
| MAexp20: | 21.70 | |
| MAexp50: | 21.54 | |
| MAexp100: | 21.29 | |
| Price / MA7: | +1.30% | |
| Price / MA20: | +5.72% | |
| Price / MA50: | - | |
| Price / MA100: | - | |
| Price / MAexp7: | +0.28% | |
| Price / MAexp20: | +0.55% | |
| Price / MAexp50: | +1.30% | |
| Price / MAexp100: | +2.49% |
Quotes :
-
15 min delayed data
-
Actions Allemagne
News
The latest news and videos published on DOUGLAS AGINH O.N. at the time of the analysis were as follows:
- EQS-News: Strong financial foundation: DOUGLAS Group reduces net debt by 1 billion euros and increases financial flexibility
- EQS-News: Douglas AG announces satisfaction of transaction conditions