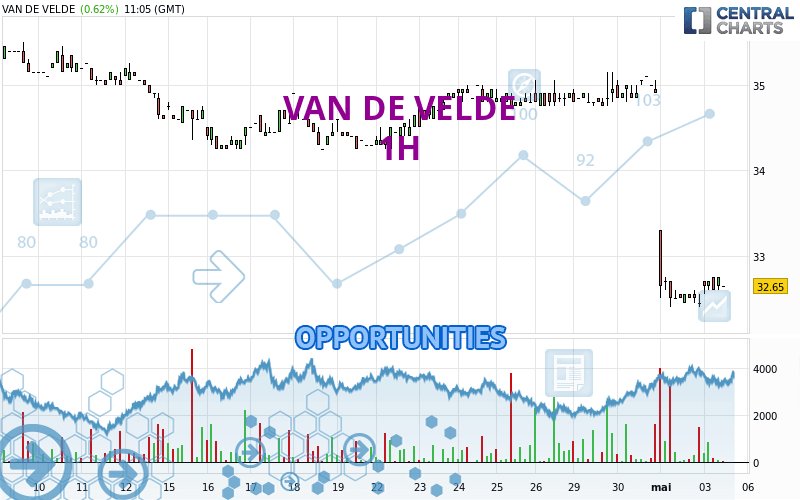
Londinia Opportunities Analyses - 05/03/2024 (GMT) VAN DE VELDE - 1H
-
EUR
(-)
-
15 min delayed data - Euronext Bruxelles
| Type: | Stocks |
| Ticker: | VAN |
| ISIN: | BE0003839561 |
- Europe Stocks
- Timeframe : 1H
- - Analysis generated on
- Status : INVALID
Summary of the analysis
Trends
Short term:
Strongly bullish
Underlying:
Strongly bullish
Technical indicators
61%
11%
28%
My opinion
Bullish above 32.59 EUR
My targets
32.92 EUR (+0.52%)
33.30 EUR (+1.68%)
My analysis
The bullish trend is currently very strong on VAN DE VELDE. As long as the price remains above the support at 32.59 EUR, you could try to benefit from the boom. The first bullish objective is located at 32.92 EUR. The bullish momentum would be boosted by a break in this resistance. Buyers would then use the next resistance located at 33.30 EUR as an objective. Crossing it would then enable buyers to target 40.15 EUR. Be careful, given the powerful bullish rally underway, excesses could lead to a possible correction in the short term. If this is the case, remember that trading against the trend may be riskier. It would seem more appropriate to wait for a signal indicating reversal of the trend.
Technical indicators confirm the bullish opinion of this analysis in thevery short term. However, be careful of excessive bullish movements. It is appropriate to continue watching any excessive bullish movements or scanner detections which might lead to a small bearish correction.
Force
0
10
7.7

Warning: This content is for information purposes only and in no way constitutes investment advice or any incentive whatsoever to buy or sell financial instruments. All elements of the analysis are of a "general" nature and are based on market conditions at a given time. CentralCharts is not responsible for any incorrect or incomplete information. Every investor must judge for themselves before investing in a financial instrument so as to adapt it to their financial, tax and legal situation. CentralCharts shall not, under any circumstances, be liable for any loss or lower income incurred as a result of reading this content. Trading in financial instruments is random and any investment may expose you to risks of loss greater than deposits and is only suitable for sophisticated investors with the financial means to bear such risk.
Additional analysis
Quotes
The VAN DE VELDE price is 32.75 EUR. On the day, this instrument gained +0.92% with the lowest point at 32.55 EUR and the highest point at 32.75 EUR. The deviation from the price is +0.61% for the low point and 0% for the high point.32.55
32.75
32.75
A study of price movements over other periods shows the following variations:
Near a new HIGH record (5 years)
Type : Bullish
Timeframe : Weekly
Near a new HIGH record (1 year)
Type : Bullish
Timeframe : Weekly
Near a new HIGH record (1st january)
Type : Bullish
Timeframe : Weekly
Near a new LOW record (1 month)
Type : Bearish
Timeframe : Weekly
The Central Volumes scanner notes the presence of abnormal volumes:
Abnormal volumes
Timeframe : 50 days
Technical
A technical analysis in 1H of this VAN DE VELDE chart shows a strongly bullish trend. 92.86% of the signals given by moving averages are bullish. This strongly bullish trend is supported by the strong bullish signals given by short-term moving averages. The Central Indicators scanner does not detect any result on moving averages that would impact this trend.
In fact, according to the parameters integrated into the Central Analyzer system, 11 technical indicators out of 18 analysed are currently bullish. The Central Indicators scanner found this result concerning these indicators:
Momentum indicator is back under 0
Type : Bearish
Timeframe : 1 hour
Central Patterns, the market scanner focusing on chart patterns, resistances and supports found this result:
Near resistance of channel
Type : Bearish
Timeframe : 1 hour
The Central Candlesticks scanner currently notes the presence of this pattern in Japanese candlesticks that could mark the end of the short-term trend currently underway:
Doji
Type : Neutral
Timeframe : 1 hour
ProTrendLines
S3
S2
S1
R1
R2
R3
Price
| S3 | S2 | S1 | Price | R1 | R2 | R3 | |
|---|---|---|---|---|---|---|---|
| ProTrendLines | 32.35 | 32.59 | 32.73 | 32.75 | 32.92 | 33.06 | 33.30 |
| Change (%) | -1.22% | -0.49% | -0.06% | - | +0.52% | +0.95% | +1.68% |
| Change | -0.40 | -0.16 | -0.02 | - | +0.17 | +0.31 | +0.55 |
| Level | Major | Intermediate | Minor | - | Major | Intermediate | Intermediate |
To determine price objectives, it is also possible to use the pivot points. Here is the price position in relation to pivot points:
Daily
| Pivot points | S3 | S2 | S1 | PP | R1 | R2 | R3 |
|---|---|---|---|---|---|---|---|
| Standard | 31.23 | 31.82 | 32.13 | 32.72 | 33.03 | 33.62 | 33.93 |
| Camarilla | 32.20 | 32.29 | 32.37 | 32.45 | 32.53 | 32.62 | 32.70 |
| Woodie | 31.10 | 31.75 | 32.00 | 32.65 | 32.90 | 33.55 | 33.80 |
| Fibonacci | 31.82 | 32.16 | 32.37 | 32.72 | 33.06 | 33.27 | 33.62 |
Weekly
| Pivot points | S3 | S2 | S1 | PP | R1 | R2 | R3 |
|---|---|---|---|---|---|---|---|
| Standard | 31.30 | 31.59 | 32.05 | 32.34 | 32.80 | 33.09 | 33.55 |
| Camarilla | 32.29 | 32.36 | 32.43 | 32.50 | 32.57 | 32.64 | 32.71 |
| Woodie | 31.38 | 31.63 | 32.13 | 32.38 | 32.88 | 33.13 | 33.63 |
| Fibonacci | 31.59 | 31.88 | 32.06 | 32.34 | 32.63 | 32.81 | 33.09 |
Monthly
| Pivot points | S3 | S2 | S1 | PP | R1 | R2 | R3 |
|---|---|---|---|---|---|---|---|
| Standard | 30.44 | 31.07 | 31.79 | 32.42 | 33.14 | 33.77 | 34.49 |
| Camarilla | 32.13 | 32.25 | 32.38 | 32.50 | 32.62 | 32.75 | 32.87 |
| Woodie | 30.48 | 31.09 | 31.83 | 32.44 | 33.18 | 33.79 | 34.53 |
| Fibonacci | 31.07 | 31.59 | 31.91 | 32.42 | 32.94 | 33.26 | 33.77 |
Numerical data
The following is the status of technical indicators and moving averages registered at the time this technical analysis was created:
Technical indicators
Moving averages
| RSI (14): | 55.73 | |
| MACD (12,26,9): | 0.0400 | |
| Directional Movement: | 17.36 | |
| AROON (14): | -14.28 | |
| DEMA (21): | 32.61 | |
| Parabolic SAR (0,02-0,02-0,2): | 33.14 | |
| Elder Ray (13): | 0.07 | |
| Super Trend (3,10): | 32.31 | |
| Zig ZAG (10): | 32.65 | |
| VORTEX (21): | 1.0000 | |
| Stochastique (14,3,5): | 27.78 | |
| TEMA (21): | 32.61 | |
| Williams %R (14): | -72.22 | |
| Chande Momentum Oscillator (20): | -0.05 | |
| Repulse (5,40,3): | -0.5600 | |
| ROCnROLL: | 1 | |
| TRIX (15,9): | 0.0100 | |
| Courbe Coppock: | 0.05 |
| MA7: | 32.51 | |
| MA20: | 32.43 | |
| MA50: | 31.64 | |
| MA100: | 31.43 | |
| MAexp7: | 32.59 | |
| MAexp20: | 32.56 | |
| MAexp50: | 32.49 | |
| MAexp100: | 32.40 | |
| Price / MA7: | +0.74% | |
| Price / MA20: | +0.99% | |
| Price / MA50: | +3.51% | |
| Price / MA100: | +4.20% | |
| Price / MAexp7: | +0.49% | |
| Price / MAexp20: | +0.58% | |
| Price / MAexp50: | +0.80% | |
| Price / MAexp100: | +1.08% |
Quotes :
-
15 min delayed data
-
Euronext Bruxelles