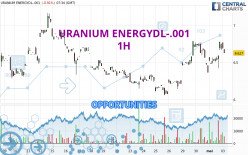
Londinia Opportunities Analyses - 05/03/2024 (GMT) URANIUM ENERGYDL-.001 - 1H
- Europe Stocks
- Timeframe : 1H
- - Analysis generated on
- Status : INVALID
Summary of the analysis
Trends
Short term:
Bullish
Underlying:
Strongly bullish
Technical indicators
78%
11%
11%
My opinion
Bullish above 6.636 EUR
My targets
6.742 EUR (+0.79%)
6.936 EUR (+3.69%)
My analysis
All elements being clearly bullish, it would be possible for traders to trade only long positions (at the time of purchase) on URANIUM ENERGYDL-.001 as long as the price remains well above 6.636 EUR. The buyers' bullish objective is set at 6.742 EUR. A bullish break in this resistance would boost the bullish momentum. The buyers could then target the resistance located at 6.936 EUR. If there is any crossing, the next objective would be the resistance located at 7.085 EUR. Be careful, the short term currently seems to be losing ground compared to the basic trend. Longer time units should be analysed to identify possible overbought items that could be a sign of a possible short-term correction.
Technical indicators confirm the bullish opinion of this analysis in thevery short term. However, be careful of excessive bullish movements. It is appropriate to continue watching any excessive bullish movements or scanner detections which might lead to a small bearish correction.
Force
0
10
7.5

Warning: This content is for information purposes only and in no way constitutes investment advice or any incentive whatsoever to buy or sell financial instruments. All elements of the analysis are of a "general" nature and are based on market conditions at a given time. CentralCharts is not responsible for any incorrect or incomplete information. Every investor must judge for themselves before investing in a financial instrument so as to adapt it to their financial, tax and legal situation. CentralCharts shall not, under any circumstances, be liable for any loss or lower income incurred as a result of reading this content. Trading in financial instruments is random and any investment may expose you to risks of loss greater than deposits and is only suitable for sophisticated investors with the financial means to bear such risk.
Additional analysis
Quotes
The URANIUM ENERGYDL-.001 price is 6.689 EUR. The price registered an increase of +0.02% on the session and was traded between 6.689 EUR and 6.771 EUR over the period. The price is currently at 0% from its lowest and -1.21% from its highest.6.689
6.771
6.689
The Central Gaps scanner detects a bullish opening marking the presence of buyers ahead of sellers at the opening but not sufficiently marked to allow the price to register a quotation gap.
Bullish opening
Type : Bullish
Timeframe : Openning
Here is a more detailed summary of the historical variations registered by URANIUM ENERGYDL-.001:
Technical
Technical analysis of this 1H chart of URANIUM ENERGYDL-.001 indicates that the overall trend is strongly bullish. 89.29% of the signals given by moving averages are bullish. The slightly bullish signals given by the short-term moving averages show a weakening of the global trend. The Central Indicators market scanner is currently detecting a bullish signal that could impact this trend:
Moving Average bullish crossovers : MA50 & MA100
Type : Bullish
Timeframe : 1 hour
An assessment of technical indicators shows a strong bullish signal.
Central Indicators, the scanner specialised in technical indicators, has identified this signal:
Pivot points : price is over resistance 2
Type : Neutral
Timeframe : Weekly
An analysis of the price chart with the Central Patterns scanner (detector of chart patterns and resistances and supports) shows a result that can have an impact on the price change:
Near resistance of channel
Type : Bearish
Timeframe : 1 hour
The Central Candlesticks scanner, specialised in Japanese candlesticks, did not identify any signals.
ProTrendLines
S3
S2
S1
R1
R2
R3
Price
| S3 | S2 | S1 | Price | R1 | R2 | R3 | |
|---|---|---|---|---|---|---|---|
| ProTrendLines | 6.275 | 6.457 | 6.636 | 6.689 | 6.742 | 6.936 | 7.085 |
| Change (%) | -6.19% | -3.47% | -0.79% | - | +0.79% | +3.69% | +5.92% |
| Change | -0.414 | -0.232 | -0.053 | - | +0.053 | +0.247 | +0.396 |
| Level | Intermediate | Minor | Minor | - | Intermediate | Minor | Intermediate |
To determine price objectives, it is also possible to use the pivot points. Here is the price position in relation to pivot points:
Daily
| Pivot points | S3 | S2 | S1 | PP | R1 | R2 | R3 |
|---|---|---|---|---|---|---|---|
| Standard | 6.126 | 6.275 | 6.481 | 6.630 | 6.836 | 6.985 | 7.191 |
| Camarilla | 6.590 | 6.623 | 6.656 | 6.688 | 6.721 | 6.753 | 6.786 |
| Woodie | 6.156 | 6.289 | 6.511 | 6.644 | 6.866 | 6.999 | 7.221 |
| Fibonacci | 6.275 | 6.410 | 6.494 | 6.630 | 6.765 | 6.849 | 6.985 |
Weekly
| Pivot points | S3 | S2 | S1 | PP | R1 | R2 | R3 |
|---|---|---|---|---|---|---|---|
| Standard | 5.705 | 5.881 | 6.047 | 6.223 | 6.389 | 6.565 | 6.731 |
| Camarilla | 6.119 | 6.150 | 6.182 | 6.213 | 6.244 | 6.276 | 6.307 |
| Woodie | 5.700 | 5.879 | 6.042 | 6.221 | 6.384 | 6.563 | 6.726 |
| Fibonacci | 5.881 | 6.012 | 6.092 | 6.223 | 6.354 | 6.434 | 6.565 |
Monthly
| Pivot points | S3 | S2 | S1 | PP | R1 | R2 | R3 |
|---|---|---|---|---|---|---|---|
| Standard | 4.764 | 5.411 | 5.887 | 6.534 | 7.010 | 7.657 | 8.133 |
| Camarilla | 6.055 | 6.158 | 6.261 | 6.364 | 6.467 | 6.570 | 6.673 |
| Woodie | 4.680 | 5.368 | 5.803 | 6.491 | 6.926 | 7.614 | 8.049 |
| Fibonacci | 5.411 | 5.840 | 6.105 | 6.534 | 6.963 | 7.228 | 7.657 |
Numerical data
The following is the status of technical indicators and moving averages registered at the time this technical analysis was created:
Technical indicators
Moving averages
| RSI (14): | 58.87 | |
| MACD (12,26,9): | 0.0560 | |
| Directional Movement: | 8.140 | |
| AROON (14): | 57.143 | |
| DEMA (21): | 6.655 | |
| Parabolic SAR (0,02-0,02-0,2): | 6.401 | |
| Elder Ray (13): | 0.123 | |
| Super Trend (3,10): | 6.436 | |
| Zig ZAG (10): | 6.689 | |
| VORTEX (21): | 0.9590 | |
| Stochastique (14,3,5): | 85.59 | |
| TEMA (21): | 6.657 | |
| Williams %R (14): | -21.50 | |
| Chande Momentum Oscillator (20): | 0.123 | |
| Repulse (5,40,3): | -1.3040 | |
| ROCnROLL: | 1 | |
| TRIX (15,9): | 0.1190 | |
| Courbe Coppock: | 0.95 |
| MA7: | 6.433 | |
| MA20: | 6.507 | |
| MA50: | 6.310 | |
| MA100: | 6.453 | |
| MAexp7: | 6.639 | |
| MAexp20: | 6.579 | |
| MAexp50: | 6.491 | |
| MAexp100: | 6.463 | |
| Price / MA7: | +3.98% | |
| Price / MA20: | +2.80% | |
| Price / MA50: | +6.01% | |
| Price / MA100: | +3.66% | |
| Price / MAexp7: | +0.75% | |
| Price / MAexp20: | +1.67% | |
| Price / MAexp50: | +3.05% | |
| Price / MAexp100: | +3.50% |
Quotes :
-
15 min delayed data
-
Actions Allemagne
News
The latest news and videos published on URANIUM ENERGYDL-.001 at the time of the analysis were as follows:
- Uranium Energy Corp. (NYSE American: UEC) Ready, Eager to Provide Much-Needed Fuel
- Uranium Energy Corp. (NYSE American: UEC) Investing in Next-Gen Uranium Mining Projects