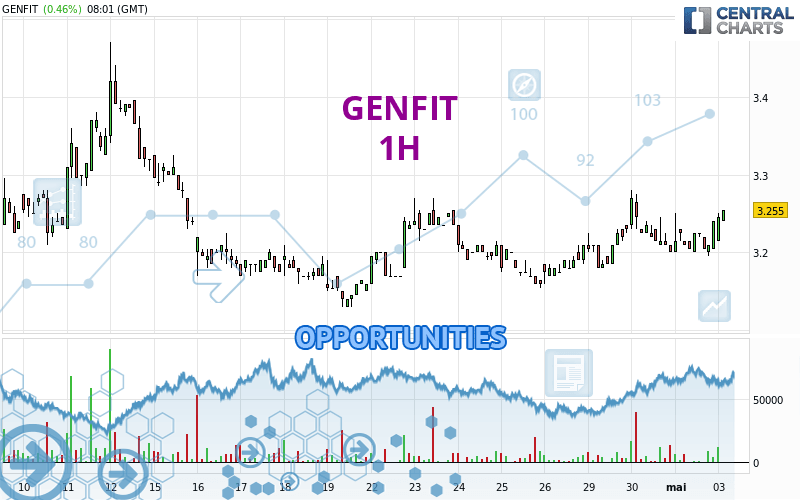
Londinia Opportunities Analyses - 05/03/2024 (GMT) GENFIT - 1H
-
EUR
(-)
-
15 min delayed data - Euronext Paris
| Type: | Stocks |
| Ticker: | GNFT |
| ISIN: | FR0004163111 |
I am delighted to see that my first price objective has been achieved. I hope you've taken advantage of it.
- Europe Stocks
- Timeframe : 1H
- - Analysis generated on
- Status : TARGET REACHED
Summary of the analysis
Trends
Short term:
Strongly bullish
Underlying:
Strongly bullish
Technical indicators
72%
11%
17%
My opinion
Bullish above 3.200 EUR
My targets
3.285 EUR (+1.39%)
3.360 EUR (+3.70%)
My analysis
All elements being clearly bullish, it would be possible for traders to trade only long positions (at the time of purchase) on GENFIT as long as the price remains well above 3.200 EUR. The buyers' bullish objective is set at 3.285 EUR. A bullish break in this resistance would boost the bullish momentum. The buyers could then target the resistance located at 3.360 EUR. If there is any crossing, the next objective would be the resistance located at 3.395 EUR. However, beware of bullish excesses that could lead to a possible short-term correction; but this possible correction would not be tradeable.
Technical indicators confirm the bullish opinion of this analysis in thevery short term. However, be careful of excessive bullish movements. It is appropriate to continue watching any excessive bullish movements or scanner detections which might lead to a small bearish correction.
Force
0
10
7.7

Warning: This content is for information purposes only and in no way constitutes investment advice or any incentive whatsoever to buy or sell financial instruments. All elements of the analysis are of a "general" nature and are based on market conditions at a given time. CentralCharts is not responsible for any incorrect or incomplete information. Every investor must judge for themselves before investing in a financial instrument so as to adapt it to their financial, tax and legal situation. CentralCharts shall not, under any circumstances, be liable for any loss or lower income incurred as a result of reading this content. Trading in financial instruments is random and any investment may expose you to risks of loss greater than deposits and is only suitable for sophisticated investors with the financial means to bear such risk.
Additional analysis
Quotes
GENFIT rating 3.240 EUR. The price has increased by +0.00% since the last closing and was traded between 3.215 EUR and 3.250 EUR over the period. The price is currently at +0.78% from its lowest and -0.31% from its highest.3.215
3.250
3.240
The Central Gaps scanner detects a bearish opening. A small advantage for sellers in the very short term.
Bearish opening
Type : Bearish
Timeframe : Openning
Here is a more detailed summary of the historical variations registered by GENFIT:
Technical
A technical analysis in 1H of this GENFIT chart shows a strongly bullish trend. The signals given by the moving averages are 89.29% bullish. This strong bullish trend is confirmed by the strong signals currently being given by short-term moving averages. An assessment of moving averages reveals several bullish signals that could impact this trend:
Bullish trend reversal : adaptative moving average 20
Type : Bullish
Timeframe : 1 hour
Bullish trend reversal : adaptative moving average 100
Type : Bullish
Timeframe : 1 hour
In fact, 13 technical indicators on 18 studied are currently bullish. Other results related to technical indicators were also found by the Central Indicators scanner:
MACD crosses UP its Moving Average
Type : Bullish
Timeframe : 1 hour
Price is back over the pivot point
Type : Bullish
Timeframe : 1 hour
Price is back over the pivot point
Type : Bullish
Timeframe : Weekly
Central Patterns, the market scanner focusing on chart patterns, resistances and supports found these results:
Near resistance of channel
Type : Bearish
Timeframe : 1 hour
Near horizontal support
Type : Bullish
Timeframe : 1 hour
The Central Candlesticks scanner, specialised in Japanese candlesticks, did not identify any signals.
ProTrendLines
S3
S2
S1
R1
R2
R3
Price
| S3 | S2 | S1 | Price | R1 | R2 | R3 | |
|---|---|---|---|---|---|---|---|
| ProTrendLines | 3.068 | 3.156 | 3.200 | 3.240 | 3.285 | 3.360 | 3.395 |
| Change (%) | -5.31% | -2.59% | -1.23% | - | +1.39% | +3.70% | +4.78% |
| Change | -0.172 | -0.084 | -0.040 | - | +0.045 | +0.120 | +0.155 |
| Level | Major | Major | Intermediate | - | Major | Minor | Minor |
Pivot points can also be used to set your price objectives. Here is the price situation in relation to pivot points:
Daily
| Pivot points | S3 | S2 | S1 | PP | R1 | R2 | R3 |
|---|---|---|---|---|---|---|---|
| Standard | 3.152 | 3.173 | 3.207 | 3.228 | 3.262 | 3.283 | 3.317 |
| Camarilla | 3.225 | 3.230 | 3.235 | 3.240 | 3.245 | 3.250 | 3.255 |
| Woodie | 3.158 | 3.176 | 3.213 | 3.231 | 3.268 | 3.286 | 3.323 |
| Fibonacci | 3.173 | 3.194 | 3.207 | 3.228 | 3.249 | 3.262 | 3.283 |
Weekly
| Pivot points | S3 | S2 | S1 | PP | R1 | R2 | R3 |
|---|---|---|---|---|---|---|---|
| Standard | 3.038 | 3.097 | 3.153 | 3.212 | 3.268 | 3.327 | 3.383 |
| Camarilla | 3.178 | 3.189 | 3.200 | 3.210 | 3.221 | 3.231 | 3.242 |
| Woodie | 3.038 | 3.096 | 3.153 | 3.211 | 3.268 | 3.326 | 3.383 |
| Fibonacci | 3.097 | 3.141 | 3.168 | 3.212 | 3.256 | 3.283 | 3.327 |
Monthly
| Pivot points | S3 | S2 | S1 | PP | R1 | R2 | R3 |
|---|---|---|---|---|---|---|---|
| Standard | 2.548 | 2.787 | 2.993 | 3.232 | 3.438 | 3.677 | 3.883 |
| Camarilla | 3.078 | 3.118 | 3.159 | 3.200 | 3.241 | 3.282 | 3.322 |
| Woodie | 2.533 | 2.779 | 2.978 | 3.224 | 3.423 | 3.669 | 3.868 |
| Fibonacci | 2.787 | 2.957 | 3.062 | 3.232 | 3.402 | 3.507 | 3.677 |
Numerical data
The following is the status of the technical indicators and moving averages at the time of publication of this technical analysis:
Technical indicators
Moving averages
| RSI (14): | 57.85 | |
| MACD (12,26,9): | 0.0050 | |
| Directional Movement: | 17.424 | |
| AROON (14): | -50.000 | |
| DEMA (21): | 3.226 | |
| Parabolic SAR (0,02-0,02-0,2): | 3.195 | |
| Elder Ray (13): | 0.007 | |
| Super Trend (3,10): | 3.195 | |
| Zig ZAG (10): | 3.240 | |
| VORTEX (21): | 0.9350 | |
| Stochastique (14,3,5): | 60.61 | |
| TEMA (21): | 3.226 | |
| Williams %R (14): | -27.27 | |
| Chande Momentum Oscillator (20): | 0.020 | |
| Repulse (5,40,3): | 1.8130 | |
| ROCnROLL: | 1 | |
| TRIX (15,9): | 0.0210 | |
| Courbe Coppock: | 0.35 |
| MA7: | 3.212 | |
| MA20: | 3.224 | |
| MA50: | 3.246 | |
| MA100: | 3.380 | |
| MAexp7: | 3.224 | |
| MAexp20: | 3.219 | |
| MAexp50: | 3.211 | |
| MAexp100: | 3.213 | |
| Price / MA7: | +0.87% | |
| Price / MA20: | +0.50% | |
| Price / MA50: | -0.18% | |
| Price / MA100: | -4.14% | |
| Price / MAexp7: | +0.50% | |
| Price / MAexp20: | +0.65% | |
| Price / MAexp50: | +0.90% | |
| Price / MAexp100: | +0.84% |
Quotes :
-
15 min delayed data
-
Euronext Paris
News
The latest news and videos published on GENFIT at the time of the analysis were as follows:
- GENFIT Announces Publication of the 2023 Universal Registration Document and the 2023 Annual Report on Form 20-F
- GENFIT Reports Full-Year 2023 Financial Results and Provides Corporate Update
- GENFIT Announces 2024 Financial Calendar
- GENFIT: Half-Year Report of Liquidity Contract with Crédit Industriel et Commercial
- Ipsen confirms U.S. FDA grants priority review for New Drug Application for elafibranor for the treatment of rare cholestatic liver disease, PBC