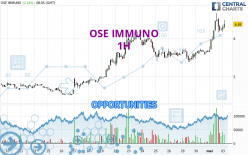
Londinia Opportunities Analyses - 05/03/2024 (GMT) OSE IMMUNO - 1H
-
EUR
(-)
-
15 min delayed data - Euronext Paris
| Type: | Stocks |
| Ticker: | OSE |
| ISIN: | FR0012127173 |
- Europe Stocks
- Timeframe : 1H
- - Analysis generated on
- Status : INVALID
Summary of the analysis
Trends
Short term:
Strongly bullish
Underlying:
Strongly bullish
Technical indicators
78%
0%
22%
My opinion
Bullish above 6.24 EUR
My targets
6.57 EUR (+3.25%)
6.95 EUR (+9.32%)
My analysis
All elements being clearly bullish, it would be possible for traders to trade only long positions (at the time of purchase) on OSE IMMUNO as long as the price remains well above 6.24 EUR. The buyers' bullish objective is set at 6.57 EUR. A bullish break in this resistance would boost the bullish momentum. The buyers could then target the resistance located at 6.95 EUR. If there is any crossing, the next objective would be the resistance located at 9.50 EUR. However, beware of bullish excesses that could lead to a possible short-term correction; but this possible correction would not be tradeable.
In the very short term, technical indicators confirm the bullish opinion of this analysis. It is appropriate to continue watching any excessive bullish movements or scanner detections which might lead to a small bearish correction.
Force
0
10
8.6

Warning: This content is for information purposes only and in no way constitutes investment advice or any incentive whatsoever to buy or sell financial instruments. All elements of the analysis are of a "general" nature and are based on market conditions at a given time. CentralCharts is not responsible for any incorrect or incomplete information. Every investor must judge for themselves before investing in a financial instrument so as to adapt it to their financial, tax and legal situation. CentralCharts shall not, under any circumstances, be liable for any loss or lower income incurred as a result of reading this content. Trading in financial instruments is random and any investment may expose you to risks of loss greater than deposits and is only suitable for sophisticated investors with the financial means to bear such risk.
Additional analysis
Quotes
The OSE IMMUNO price is 6.36 EUR. The price has increased by +1.92% since the last closing and was between 6.17 EUR and 6.36 EUR. This implies that the price is at +3.08% from its lowest and at 0% from its highest.6.17
6.36
6.36
A study of price movements over other periods shows the following variations:
Technical
A technical analysis in 1H of this OSE IMMUNO chart shows a strongly bullish trend. The signals given by the moving averages are 92.86% bullish. This strong bullish trend is confirmed by the strong signals currently being given by short-term moving averages. There is no crossing of moving average by the price or crossing of moving averages between themselves.
An assessment of technical indicators shows a strong bullish signal.
Central Indicators, the scanner specialised in technical indicators, has identified these signals:
Pivot points : price is over resistance 1
Type : Neutral
Timeframe : Weekly
Parabolic SAR indicator bearish reversal
Type : Bearish
Timeframe : 1 hour
An analysis of the price chart with the Central Patterns scanner (detector of chart patterns and resistances and supports) shows a result that can have an impact on the price change:
Near horizontal support
Type : Bullish
Timeframe : 1 hour
No result was found by the Central Candlesticks scanner on Japanese candlesticks.
ProTrendLines
S3
S2
S1
R1
R2
R3
Price
| S3 | S2 | S1 | Price | R1 | R2 | R3 | |
|---|---|---|---|---|---|---|---|
| ProTrendLines | 5.73 | 5.97 | 6.24 | 6.36 | 9.50 | 11.60 | 13.16 |
| Change (%) | -9.91% | -6.13% | -1.89% | - | +49.37% | +82.39% | +106.92% |
| Change | -0.63 | -0.39 | -0.12 | - | +3.14 | +5.24 | +6.80 |
| Level | Intermediate | Intermediate | Major | - | Minor | Minor | Intermediate |
Attention could also be paid to pivot points to set price objectives:
Daily
| Pivot points | S3 | S2 | S1 | PP | R1 | R2 | R3 |
|---|---|---|---|---|---|---|---|
| Standard | 4.68 | 5.17 | 5.70 | 6.19 | 6.72 | 7.21 | 7.74 |
| Camarilla | 5.96 | 6.05 | 6.15 | 6.24 | 6.33 | 6.43 | 6.52 |
| Woodie | 4.71 | 5.18 | 5.73 | 6.20 | 6.75 | 7.22 | 7.77 |
| Fibonacci | 5.17 | 5.56 | 5.80 | 6.19 | 6.58 | 6.82 | 7.21 |
Weekly
| Pivot points | S3 | S2 | S1 | PP | R1 | R2 | R3 |
|---|---|---|---|---|---|---|---|
| Standard | 4.28 | 4.79 | 5.17 | 5.68 | 6.06 | 6.57 | 6.95 |
| Camarilla | 5.32 | 5.40 | 5.48 | 5.56 | 5.64 | 5.72 | 5.81 |
| Woodie | 4.23 | 4.76 | 5.12 | 5.65 | 6.01 | 6.54 | 6.90 |
| Fibonacci | 4.79 | 5.13 | 5.34 | 5.68 | 6.02 | 6.23 | 6.57 |
Monthly
| Pivot points | S3 | S2 | S1 | PP | R1 | R2 | R3 |
|---|---|---|---|---|---|---|---|
| Standard | 3.04 | 3.77 | 4.71 | 5.44 | 6.38 | 7.11 | 8.05 |
| Camarilla | 5.18 | 5.33 | 5.49 | 5.64 | 5.79 | 5.95 | 6.10 |
| Woodie | 3.14 | 3.82 | 4.81 | 5.49 | 6.48 | 7.16 | 8.15 |
| Fibonacci | 3.77 | 4.41 | 4.81 | 5.44 | 6.08 | 6.48 | 7.11 |
Numerical data
The following are the details of the technical indicators and moving averages that were collected to generate this technical analysis:
Technical indicators
Moving averages
| RSI (14): | 65.46 | |
| MACD (12,26,9): | 0.1900 | |
| Directional Movement: | 21.64 | |
| AROON (14): | 57.14 | |
| DEMA (21): | 6.21 | |
| Parabolic SAR (0,02-0,02-0,2): | 6.67 | |
| Elder Ray (13): | 0.16 | |
| Super Trend (3,10): | 6.10 | |
| Zig ZAG (10): | 6.26 | |
| VORTEX (21): | 1.2100 | |
| Stochastique (14,3,5): | 61.47 | |
| TEMA (21): | 6.36 | |
| Williams %R (14): | -33.94 | |
| Chande Momentum Oscillator (20): | 0.71 | |
| Repulse (5,40,3): | 0.5300 | |
| ROCnROLL: | 1 | |
| TRIX (15,9): | 0.3500 | |
| Courbe Coppock: | 22.61 |
| MA7: | 5.79 | |
| MA20: | 5.27 | |
| MA50: | 4.89 | |
| MA100: | 4.41 | |
| MAexp7: | 6.23 | |
| MAexp20: | 6.00 | |
| MAexp50: | 5.79 | |
| MAexp100: | 5.57 | |
| Price / MA7: | +9.84% | |
| Price / MA20: | +20.68% | |
| Price / MA50: | +30.06% | |
| Price / MA100: | +44.22% | |
| Price / MAexp7: | +2.09% | |
| Price / MAexp20: | +6.00% | |
| Price / MAexp50: | +9.84% | |
| Price / MAexp100: | +14.18% |
Quotes :
-
15 min delayed data
-
Euronext Paris
News
Don't forget to follow the news on OSE IMMUNO. At the time of publication of this analysis, the latest news was as follows:
- OSE Immunotherapeutics Receives €8.4 M in Public Funding to Support the Registration Phase 3 Clinical Trial of Cancer Vaccine Tedopi® in Lung Cancer
- AbbVie and OSE Immunotherapeutics Announce Partnership to Develop a Novel Monoclonal Antibody for the Treatment of Chronic Inflammation
- OSE Immunotherapeutics Announces New Public Grant to Support Innovation and Research Programs in the Field of RNA Therapeutics
- OSE Immunotherapeutics Announces Publication in Frontiers in Immunology on OSE-230, its Novel Agonist Therapy in Chronic Inflammation
- OSE Immunotherapeutics and Nantes University Hospital Announce Completion of Patient Enrollment in the FIRsT Clinical Trial, a Phase 1/2 Study Evaluating FR104/VEL-101 Immunotherapy in Renal Transplantation