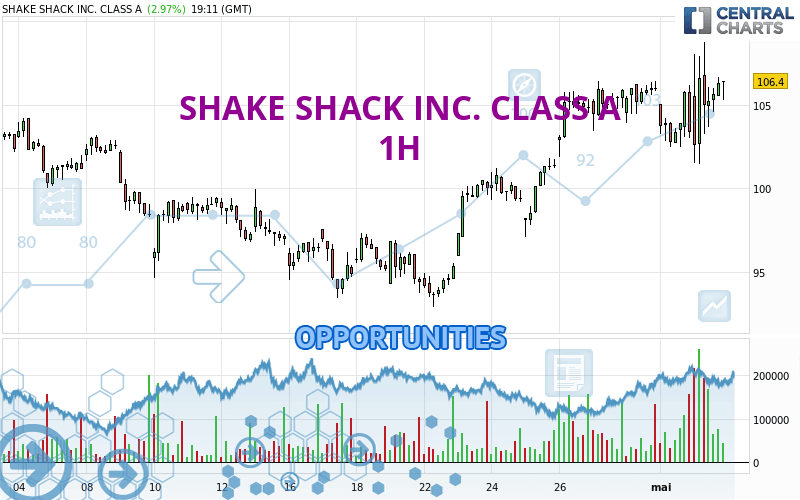
Londinia Opportunities Analyses - 05/02/2024 (GMT) SHAKE SHACK INC. CLASS A - 1H
I am delighted to see that my first price objective has been achieved. I hope you've taken advantage of it.
- U.S. Stocks
- Timeframe : 1H
- - Analysis generated on
- Status : TARGET REACHED
Summary of the analysis
Trends
Short term:
Strongly bullish
Underlying:
Strongly bullish
Technical indicators
72%
6%
22%
My opinion
Bullish above 104.61 USD
My targets
109.27 USD (+2.95%)
110.90 USD (+4.48%)
My analysis
SHAKE SHACK INC. CLASS A is part of a very strong bullish trend. Traders may consider trading only long positions (at the time of purchase) as long as the price remains well above 104.61 USD. The next resistance located at 109.27 USD is the next bullish objective to be reached. A bullish break in this resistance would boost the bullish momentum. The bullish movement could then continue towards the next resistance located at 110.90 USD. After this resistance, buyers could then target 130.76 USD. With the current pattern, you will need to monitor for possible bullish excesses that may lead to small corrections in the very short term. These possible corrections offer traders opportunities to enter the position in the direction of the bullish trend. Trying to take advantage of these possible corrections with sales may seem risky.
In the very short term, the general bullish sentiment is confirmed by technical indicators. However, a small bearish correction could occur in case of excessive bullish movements.
Force
0
10
8.2

Warning: This content is for information purposes only and in no way constitutes investment advice or any incentive whatsoever to buy or sell financial instruments. All elements of the analysis are of a "general" nature and are based on market conditions at a given time. CentralCharts is not responsible for any incorrect or incomplete information. Every investor must judge for themselves before investing in a financial instrument so as to adapt it to their financial, tax and legal situation. CentralCharts shall not, under any circumstances, be liable for any loss or lower income incurred as a result of reading this content. Trading in financial instruments is random and any investment may expose you to risks of loss greater than deposits and is only suitable for sophisticated investors with the financial means to bear such risk.
Additional analysis
Quotes
SHAKE SHACK INC. CLASS A rating 106.14 USD. On the day, this instrument gained +2.72% with the lowest point at 101.46 USD and the highest point at 108.73 USD. The deviation from the price is +4.61% for the low point and -2.38% for the high point.101.46
108.73
106.14
The Central Gaps scanner detects a bullish opening marking the presence of buyers ahead of sellers at the opening but not sufficiently marked to allow the price to register a quotation gap.
Bullish opening
Type : Bullish
Timeframe : Openning
Here is a more detailed summary of the historical variations registered by SHAKE SHACK INC. CLASS A:
Near a new HIGH record (1 year)
Type : Bullish
Timeframe : Weekly
Near a new HIGH record (1st january)
Type : Bullish
Timeframe : Weekly
New HIGH record (1 month)
Type : Bullish
Timeframe : Weekly
Technical
Technical analysis of SHAKE SHACK INC. CLASS A in 1H shows a strongly overall bullish trend. 92.86% of the signals given by moving averages are bullish. The overall trend is supported by the strong bullish signals from short-term moving averages. The Central Indicators market scanner is currently detecting a bullish signal that could impact this trend:
Bullish trend reversal : Moving Average 20
Type : Bullish
Timeframe : 1 hour
An assessment of technical indicators shows a strong bullish signal.
Other results related to technical indicators were also found by the Central Indicators scanner:
Pivot points : price is over resistance 1
Type : Neutral
Timeframe : 1 hour
MACD crosses UP its Moving Average
Type : Bullish
Timeframe : 1 hour
Momentum indicator is back over 0
Type : Bullish
Timeframe : 1 hour
No signals are given by Central Patterns, a market scanner specialised in chart patterns, resistances and supports.
The Central Candlesticks scanner, specialised in Japanese candlesticks, did not identify any signals.
ProTrendLines
S3
S2
S1
R1
R2
R3
Price
| S3 | S2 | S1 | Price | R1 | R2 | R3 | |
|---|---|---|---|---|---|---|---|
| ProTrendLines | 99.99 | 102.40 | 104.61 | 106.14 | 106.38 | 109.27 | 110.90 |
| Change (%) | -5.79% | -3.52% | -1.44% | - | +0.23% | +2.95% | +4.48% |
| Change | -6.15 | -3.74 | -1.53 | - | +0.24 | +3.13 | +4.76 |
| Level | Intermediate | Intermediate | Major | - | Major | Major | Minor |
Pivot points can also be used to set your price objectives. Here is the price situation in relation to pivot points:
Daily
| Pivot points | S3 | S2 | S1 | PP | R1 | R2 | R3 |
|---|---|---|---|---|---|---|---|
| Standard | 98.15 | 100.31 | 101.82 | 103.98 | 105.49 | 107.65 | 109.16 |
| Camarilla | 102.32 | 102.66 | 102.99 | 103.33 | 103.67 | 104.00 | 104.34 |
| Woodie | 97.83 | 100.15 | 101.50 | 103.82 | 105.17 | 107.49 | 108.84 |
| Fibonacci | 100.31 | 101.71 | 102.58 | 103.98 | 105.38 | 106.25 | 107.65 |
Weekly
| Pivot points | S3 | S2 | S1 | PP | R1 | R2 | R3 |
|---|---|---|---|---|---|---|---|
| Standard | 83.72 | 88.33 | 96.60 | 101.21 | 109.48 | 114.09 | 122.36 |
| Camarilla | 101.34 | 102.52 | 103.70 | 104.88 | 106.06 | 107.24 | 108.42 |
| Woodie | 85.56 | 89.25 | 98.44 | 102.13 | 111.32 | 115.01 | 124.20 |
| Fibonacci | 88.33 | 93.25 | 96.29 | 101.21 | 106.13 | 109.17 | 114.09 |
Monthly
| Pivot points | S3 | S2 | S1 | PP | R1 | R2 | R3 |
|---|---|---|---|---|---|---|---|
| Standard | 82.32 | 87.62 | 96.74 | 102.04 | 111.16 | 116.46 | 125.58 |
| Camarilla | 101.89 | 103.21 | 104.53 | 105.85 | 107.17 | 108.49 | 109.82 |
| Woodie | 84.22 | 88.58 | 98.64 | 103.00 | 113.06 | 117.42 | 127.48 |
| Fibonacci | 87.62 | 93.13 | 96.54 | 102.04 | 107.55 | 110.96 | 116.46 |
Numerical data
The following is the status of the technical indicators and moving averages at the time of publication of this technical analysis:
Technical indicators
Moving averages
| RSI (14): | 56.43 | |
| MACD (12,26,9): | 0.5000 | |
| Directional Movement: | 11.26 | |
| AROON (14): | 7.14 | |
| DEMA (21): | 105.53 | |
| Parabolic SAR (0,02-0,02-0,2): | 101.75 | |
| Elder Ray (13): | 1.07 | |
| Super Trend (3,10): | 110.98 | |
| Zig ZAG (10): | 106.16 | |
| VORTEX (21): | 1.0200 | |
| Stochastique (14,3,5): | 58.23 | |
| TEMA (21): | 105.13 | |
| Williams %R (14): | -33.43 | |
| Chande Momentum Oscillator (20): | 2.53 | |
| Repulse (5,40,3): | 1.1500 | |
| ROCnROLL: | 1 | |
| TRIX (15,9): | 0.0600 | |
| Courbe Coppock: | 0.40 |
| MA7: | 103.87 | |
| MA20: | 99.90 | |
| MA50: | 102.06 | |
| MA100: | 88.27 | |
| MAexp7: | 105.31 | |
| MAexp20: | 104.76 | |
| MAexp50: | 103.26 | |
| MAexp100: | 101.83 | |
| Price / MA7: | +2.19% | |
| Price / MA20: | +6.25% | |
| Price / MA50: | +4.00% | |
| Price / MA100: | +20.24% | |
| Price / MAexp7: | +0.79% | |
| Price / MAexp20: | +1.32% | |
| Price / MAexp50: | +2.79% | |
| Price / MAexp100: | +4.23% |
Quotes :
-
15 min delayed data
-
Actions NYSE
News
The last news published on SHAKE SHACK INC. CLASS A at the time of the generation of this analysis was as follows:
- Shake Shack Announces Third Quarter 2023 Financial Results
- Shake Shack Announces Second Quarter 2023 Financial Results
- Shake Shack to Announce Second Quarter 2023 Financial Results on August 3, 2023
- Shake Shack Elects Chuck Chapman to its Board of Directors
- Shake Shack Announces Fourth Annual Stand for Something Good® Summary