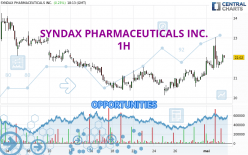
Londinia Opportunities Analyses - 05/02/2024 (GMT) SYNDAX PHARMACEUTICALS INC. - 1H
I am delighted to see that my first price objective has been achieved. I hope you've taken advantage of it.
- U.S. Stocks
- Timeframe : 1H
- - Analysis generated on
- Status : TARGET REACHED
Summary of the analysis
Trends
Short term:
Strongly bullish
Underlying:
Strongly bullish
Technical indicators
78%
6%
17%
My opinion
Bullish above 21.80 USD
My targets
22.42 USD (+1.49%)
22.85 USD (+3.44%)
My analysis
The bullish trend is currently very strong on SYNDAX PHARMACEUTICALS INC.. As long as the price remains above the support at 21.80 USD, you could try to benefit from the boom. The first bullish objective is located at 22.42 USD. The bullish momentum would be boosted by a break in this resistance. Buyers would then use the next resistance located at 22.85 USD as an objective. Crossing it would then enable buyers to target 23.33 USD. Be careful, given the powerful bullish rally underway, excesses could lead to a possible correction in the short term. If this is the case, remember that trading against the trend may be riskier. It would seem more appropriate to wait for a signal indicating reversal of the trend.
In the very short term, the general bullish sentiment is confirmed by technical indicators. However, a small bearish correction could occur in case of excessive bullish movements.
Force
0
10
8

Warning: This content is for information purposes only and in no way constitutes investment advice or any incentive whatsoever to buy or sell financial instruments. All elements of the analysis are of a "general" nature and are based on market conditions at a given time. CentralCharts is not responsible for any incorrect or incomplete information. Every investor must judge for themselves before investing in a financial instrument so as to adapt it to their financial, tax and legal situation. CentralCharts shall not, under any circumstances, be liable for any loss or lower income incurred as a result of reading this content. Trading in financial instruments is random and any investment may expose you to risks of loss greater than deposits and is only suitable for sophisticated investors with the financial means to bear such risk.
Additional analysis
Quotes
SYNDAX PHARMACEUTICALS INC. rating 22.09 USD. On the day, this instrument gained +0.55% and was traded between 21.50 USD and 22.33 USD over the period. The price is currently at +2.74% from its lowest and -1.07% from its highest.21.50
22.33
22.09
A bullish opening was detected by the Central Gaps scanner. Buyers are trying to impose a bullish momentum in the very short term.
Bullish opening
Type : Bullish
Timeframe : Openning
So that you have an overall view of the price change, here is a table showing the variations over several periods:
Technical
Technical analysis of this 1H chart of SYNDAX PHARMACEUTICALS INC. indicates that the overall trend is strongly bullish. 89.29% of the signals given by moving averages are bullish. This strongly bullish trend is supported by the strong bullish signals given by short-term moving averages. The Central Indicators scanner detects bullish signals on moving averages that could impact this trend:
Bullish trend reversal : Moving Average 100
Type : Bullish
Timeframe : 1 hour
Moving Average bullish crossovers : MA50 & MA100
Type : Bullish
Timeframe : 1 hour
Technical indicators are strongly bullish, suggesting that the price increase should continue.
Central Indicators, the detector scanner for these technical indicators has recently detected several signals:
Pivot points : price is over resistance 1
Type : Neutral
Timeframe : Weekly
Price is back over the pivot point
Type : Bullish
Timeframe : 1 hour
Williams %R indicator is back over -50
Type : Bullish
Timeframe : 1 hour
No signals are given by Central Patterns, a market scanner specialised in chart patterns, resistances and supports.
No result was found by the Central Candlesticks scanner on Japanese candlesticks.
ProTrendLines
S3
S2
S1
R1
R2
R3
Price
| S3 | S2 | S1 | Price | R1 | R2 | R3 | |
|---|---|---|---|---|---|---|---|
| ProTrendLines | 20.49 | 21.43 | 21.80 | 22.09 | 22.42 | 22.85 | 23.33 |
| Change (%) | -7.24% | -2.99% | -1.31% | - | +1.49% | +3.44% | +5.61% |
| Change | -1.60 | -0.66 | -0.29 | - | +0.33 | +0.76 | +1.24 |
| Level | Major | Major | Minor | - | Major | Intermediate | Minor |
Pivot points can also be used to set your price objectives. Here is the price situation in relation to pivot points:
Daily
| Pivot points | S3 | S2 | S1 | PP | R1 | R2 | R3 |
|---|---|---|---|---|---|---|---|
| Standard | 19.18 | 20.16 | 21.07 | 22.05 | 22.96 | 23.94 | 24.85 |
| Camarilla | 21.45 | 21.62 | 21.80 | 21.97 | 22.14 | 22.32 | 22.49 |
| Woodie | 19.14 | 20.14 | 21.03 | 22.03 | 22.92 | 23.92 | 24.81 |
| Fibonacci | 20.16 | 20.89 | 21.33 | 22.05 | 22.78 | 23.22 | 23.94 |
Weekly
| Pivot points | S3 | S2 | S1 | PP | R1 | R2 | R3 |
|---|---|---|---|---|---|---|---|
| Standard | 18.87 | 19.50 | 20.28 | 20.91 | 21.69 | 22.32 | 23.10 |
| Camarilla | 20.67 | 20.80 | 20.93 | 21.06 | 21.19 | 21.32 | 21.45 |
| Woodie | 18.95 | 19.54 | 20.36 | 20.95 | 21.77 | 22.36 | 23.18 |
| Fibonacci | 19.50 | 20.04 | 20.37 | 20.91 | 21.45 | 21.78 | 22.32 |
Monthly
| Pivot points | S3 | S2 | S1 | PP | R1 | R2 | R3 |
|---|---|---|---|---|---|---|---|
| Standard | 15.13 | 17.63 | 19.38 | 21.88 | 23.63 | 26.13 | 27.88 |
| Camarilla | 19.96 | 20.35 | 20.74 | 21.13 | 21.52 | 21.91 | 22.30 |
| Woodie | 14.76 | 17.44 | 19.01 | 21.69 | 23.26 | 25.94 | 27.51 |
| Fibonacci | 17.63 | 19.25 | 20.26 | 21.88 | 23.50 | 24.51 | 26.13 |
Numerical data
The following are the details of the technical indicators and moving averages that were collected to generate this technical analysis:
Technical indicators
Moving averages
| RSI (14): | 60.66 | |
| MACD (12,26,9): | 0.2400 | |
| Directional Movement: | 23.89 | |
| AROON (14): | 64.29 | |
| DEMA (21): | 21.91 | |
| Parabolic SAR (0,02-0,02-0,2): | 21.37 | |
| Elder Ray (13): | 0.26 | |
| Super Trend (3,10): | 21.12 | |
| Zig ZAG (10): | 22.09 | |
| VORTEX (21): | 1.0400 | |
| Stochastique (14,3,5): | 43.46 | |
| TEMA (21): | 22.02 | |
| Williams %R (14): | -46.94 | |
| Chande Momentum Oscillator (20): | 0.99 | |
| Repulse (5,40,3): | 1.4500 | |
| ROCnROLL: | 1 | |
| TRIX (15,9): | 0.1500 | |
| Courbe Coppock: | 6.95 |
| MA7: | 21.27 | |
| MA20: | 21.53 | |
| MA50: | 22.57 | |
| MA100: | 21.83 | |
| MAexp7: | 21.85 | |
| MAexp20: | 21.60 | |
| MAexp50: | 21.34 | |
| MAexp100: | 21.40 | |
| Price / MA7: | +3.86% | |
| Price / MA20: | +2.60% | |
| Price / MA50: | -2.13% | |
| Price / MA100: | +1.19% | |
| Price / MAexp7: | +1.10% | |
| Price / MAexp20: | +2.27% | |
| Price / MAexp50: | +3.51% | |
| Price / MAexp100: | +3.22% |
Quotes :
-
15 min delayed data
-
Actions NASDAQ
News
Don't forget to follow the news on SYNDAX PHARMACEUTICALS INC.. At the time of publication of this analysis, the latest news was as follows:
- Syndax to Announce First Quarter 2024 Financial Results and Host Conference Call and Webcast on May 8, 2024
- Syndax Announces Participation at the Stifel 2024 Virtual Targeted Oncology Forum
- Syndax Presents Positive Pediatric Data from Pivotal AUGMENT-101 Trial of Revumenib in Relapsed/Refractory KMT2Ar Acute Leukemia at ASPHO Plenary Session
- Syndax Pharmaceuticals Reports Inducement Grants Under NASDAQ Listing Rule 5635(c)(4)
- Syndax Announces Completion of Enrollment in AUGMENT-101 Pivotal Trial Cohort of Patients with Relapsed/Refractory mNPM1 Acute Myeloid Leukemia