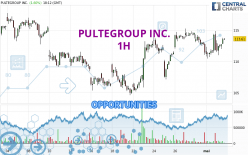
Londinia Opportunities Analyses - 05/02/2024 (GMT) PULTEGROUP INC. - 1H
I am delighted to see that my first price objective has been achieved. I hope you've taken advantage of it.
- U.S. Stocks
- Timeframe : 1H
- - Analysis generated on
- Status : TARGET REACHED
Summary of the analysis
Trends
Short term:
Bullish
Underlying:
Strongly bullish
Technical indicators
83%
6%
11%
My opinion
Bullish above 112.36 USD
My targets
115.28 USD (+1.40%)
117.75 USD (+3.57%)
My analysis
The basic bullish trend is very strong on PULTEGROUP INC. but the short term shows some signs of running out of steam. However, a purchase could be considered as long as the price remains above 112.36 USD. Crossing the first resistance at 115.28 USD would be a sign of a potential new surge in the price. Buyers would then use the next resistance located at 117.75 USD as an objective. Crossing it would then enable buyers to target 120.62 USD. Caution, a return to below 112.36 USD would be a sign of a consolidation phase in the short-term basic trend. If this is the case, remember that trading against the trend may be riskier. It would seem more appropriate to wait for a signal indicating reversal of the trend.
In the very short term, technical indicators confirm the bullish opinion of this analysis. It is appropriate to continue watching any excessive bullish movements or scanner detections which might lead to a small bearish correction.
Force
0
10
7.9

Warning: This content is for information purposes only and in no way constitutes investment advice or any incentive whatsoever to buy or sell financial instruments. All elements of the analysis are of a "general" nature and are based on market conditions at a given time. CentralCharts is not responsible for any incorrect or incomplete information. Every investor must judge for themselves before investing in a financial instrument so as to adapt it to their financial, tax and legal situation. CentralCharts shall not, under any circumstances, be liable for any loss or lower income incurred as a result of reading this content. Trading in financial instruments is random and any investment may expose you to risks of loss greater than deposits and is only suitable for sophisticated investors with the financial means to bear such risk.
Additional analysis
Quotes
The PULTEGROUP INC. rating is 113.69 USD. The price registered an increase of +1.67% on the session and was between 111.00 USD and 113.78 USD. This implies that the price is at +2.42% from its lowest and at -0.08% from its highest.111.00
113.78
113.69
A bullish opening was detected by the Central Gaps scanner. Buyers are trying to impose a bullish momentum in the very short term.
Bullish opening
Type : Bullish
Timeframe : Openning
Here is a more detailed summary of the historical variations registered by PULTEGROUP INC.:
Near a new HIGH record (1 month)
Type : Bullish
Timeframe : Weekly
Technical
Technical analysis of this 1H chart of PULTEGROUP INC. indicates that the overall trend is strongly bullish. 89.29% of the signals given by moving averages are bullish. The slightly bullish signals given by the short-term moving averages indicate this trend is showing signs of running out of steam. There is no crossing of moving average by the price or crossing of moving averages between themselves.
In fact, 15 technical indicators on 18 studied are currently positioned bullish. Other results related to technical indicators were also found by the Central Indicators scanner:
MACD crosses UP its Moving Average
Type : Bullish
Timeframe : 1 hour
MACD indicator is back over 0
Type : Bullish
Timeframe : 1 hour
Momentum indicator is back over 0
Type : Bullish
Timeframe : 1 hour
An analysis of the price chart with the Central Patterns scanner (detector of chart patterns and resistances and supports) shows a result that can have an impact on the price change:
Resistance of channel is broken
Type : Bullish
Timeframe : 1 hour
The presence of a bullish Japanese candlestick pattern detected by Central Candlesticks that could cause a very short term rebound was also detected:
Upside gap
Type : Bullish
Timeframe : 1 hour
ProTrendLines
S3
S2
S1
R1
R2
R3
Price
| S3 | S2 | S1 | Price | R1 | R2 | R3 | |
|---|---|---|---|---|---|---|---|
| ProTrendLines | 107.11 | 109.66 | 112.36 | 113.69 | 113.84 | 115.28 | 117.75 |
| Change (%) | -5.79% | -3.54% | -1.17% | - | +0.13% | +1.40% | +3.57% |
| Change | -6.58 | -4.03 | -1.33 | - | +0.15 | +1.59 | +4.06 |
| Level | Intermediate | Minor | Intermediate | - | Minor | Intermediate | Minor |
Pivot points can also be used to set your price objectives. Here is the price situation in relation to pivot points:
Daily
| Pivot points | S3 | S2 | S1 | PP | R1 | R2 | R3 |
|---|---|---|---|---|---|---|---|
| Standard | 105.44 | 107.94 | 109.88 | 112.38 | 114.32 | 116.82 | 118.76 |
| Camarilla | 110.60 | 111.01 | 111.41 | 111.82 | 112.23 | 112.63 | 113.04 |
| Woodie | 105.16 | 107.80 | 109.60 | 112.24 | 114.04 | 116.68 | 118.48 |
| Fibonacci | 107.94 | 109.64 | 110.68 | 112.38 | 114.08 | 115.12 | 116.82 |
Weekly
| Pivot points | S3 | S2 | S1 | PP | R1 | R2 | R3 |
|---|---|---|---|---|---|---|---|
| Standard | 98.22 | 101.70 | 107.75 | 111.23 | 117.28 | 120.76 | 126.81 |
| Camarilla | 111.18 | 112.05 | 112.93 | 113.80 | 114.67 | 115.55 | 116.42 |
| Woodie | 99.51 | 102.34 | 109.04 | 111.87 | 118.57 | 121.40 | 128.10 |
| Fibonacci | 101.70 | 105.34 | 107.59 | 111.23 | 114.87 | 117.12 | 120.76 |
Monthly
| Pivot points | S3 | S2 | S1 | PP | R1 | R2 | R3 |
|---|---|---|---|---|---|---|---|
| Standard | 87.19 | 95.89 | 103.66 | 112.36 | 120.13 | 128.83 | 136.60 |
| Camarilla | 106.89 | 108.40 | 109.91 | 111.42 | 112.93 | 114.44 | 115.95 |
| Woodie | 86.72 | 95.66 | 103.19 | 112.13 | 119.66 | 128.60 | 136.13 |
| Fibonacci | 95.89 | 102.19 | 106.07 | 112.36 | 118.66 | 122.54 | 128.83 |
Numerical data
The following is the status of the technical indicators and moving averages at the time of publication of this technical analysis:
Technical indicators
Moving averages
| RSI (14): | 55.96 | |
| MACD (12,26,9): | 0.0300 | |
| Directional Movement: | 10.25 | |
| AROON (14): | 35.72 | |
| DEMA (21): | 112.67 | |
| Parabolic SAR (0,02-0,02-0,2): | 111.16 | |
| Elder Ray (13): | 0.71 | |
| Super Trend (3,10): | 109.59 | |
| Zig ZAG (10): | 113.52 | |
| VORTEX (21): | 0.9200 | |
| Stochastique (14,3,5): | 56.04 | |
| TEMA (21): | 112.34 | |
| Williams %R (14): | -30.18 | |
| Chande Momentum Oscillator (20): | 2.11 | |
| Repulse (5,40,3): | 1.1300 | |
| ROCnROLL: | 1 | |
| TRIX (15,9): | -0.0100 | |
| Courbe Coppock: | 0.82 |
| MA7: | 112.68 | |
| MA20: | 111.01 | |
| MA50: | 111.69 | |
| MA100: | 107.33 | |
| MAexp7: | 112.91 | |
| MAexp20: | 112.58 | |
| MAexp50: | 112.10 | |
| MAexp100: | 111.64 | |
| Price / MA7: | +0.90% | |
| Price / MA20: | +2.41% | |
| Price / MA50: | +1.79% | |
| Price / MA100: | +5.93% | |
| Price / MAexp7: | +0.69% | |
| Price / MAexp20: | +0.99% | |
| Price / MAexp50: | +1.42% | |
| Price / MAexp100: | +1.84% |
Quotes :
-
15 min delayed data
-
Actions NYSE
News
The latest news and videos published on PULTEGROUP INC. at the time of the analysis were as follows:
- SHAREHOLDER ALERT: The Miller Law Firm, P.C. Investigates Claims on Behalf of Investors of PulteGroup, Inc. Relating to Alleged Attempts to Suppress Negative Media Reports.
- Building Homes for Heroes pays off mortgage for ailing veteran, honors PulteGroup
- PulteGroup expands Northeast Florida presence with announcement of two new communities in northern St. Johns County
- Trading the Beach for Grandbabies? Del Webb Building New 55+ Communities to Satisfy Growing Demand for Retirees in the Midwest
- PulteGroup Dedicates New Mortgage-Free Home in Southwest Florida to U.S. Army Veteran and Family