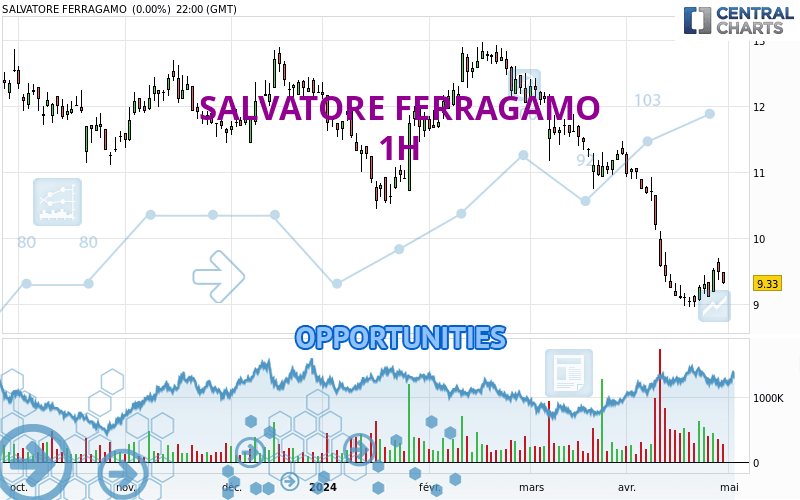
Londinia Opportunities Analyses - 05/02/2024 (GMT) SALVATORE FERRAGAMO - 1H
-
EUR
(-)
-
15 min delayed data - Italy Stocks
| Type: | Stocks |
| Ticker: | SFER |
| ISIN: | IT0004712375 |
I am delighted to see that my first price objective has been achieved. I hope you've taken advantage of it.
- Europe Stocks
- Timeframe : 1H
- - Analysis generated on
- Status : TARGET REACHED
Summary of the analysis
Trends
Short term:
Strongly bullish
Underlying:
Strongly bullish
Technical indicators
67%
0%
33%
My opinion
Bullish above 9.300 EUR
My targets
9.695 EUR (+2.16%)
10.302 EUR (+8.55%)
My analysis
The bullish trend is currently very strong on SALVATORE FERRAGAMO. As long as the price remains above the support at 9.300 EUR, you could try to benefit from the boom. The first bullish objective is located at 9.695 EUR. The bullish momentum would be boosted by a break in this resistance. Buyers would then use the next resistance located at 10.302 EUR as an objective. Crossing it would then enable buyers to target 10.560 EUR. Be careful, given the powerful bullish rally underway, excesses could lead to a possible correction in the short term. If this is the case, remember that trading against the trend may be riskier. It would seem more appropriate to wait for a signal indicating reversal of the trend.
Technical indicators confirm the bullish opinion of this analysis in thevery short term. However, be careful of excessive bullish movements. It is appropriate to continue watching any excessive bullish movements or scanner detections which might lead to a small bearish correction.
Force
0
10
7.5

Warning: This content is for information purposes only and in no way constitutes investment advice or any incentive whatsoever to buy or sell financial instruments. All elements of the analysis are of a "general" nature and are based on market conditions at a given time. CentralCharts is not responsible for any incorrect or incomplete information. Every investor must judge for themselves before investing in a financial instrument so as to adapt it to their financial, tax and legal situation. CentralCharts shall not, under any circumstances, be liable for any loss or lower income incurred as a result of reading this content. Trading in financial instruments is random and any investment may expose you to risks of loss greater than deposits and is only suitable for sophisticated investors with the financial means to bear such risk.
Additional analysis
Quotes
The SALVATORE FERRAGAMO price is 9.490 EUR. On the day, this instrument gained +1.72% and was traded between 9.285 EUR and 9.520 EUR over the period. The price is currently at +2.21% from its lowest and -0.32% from its highest.9.285
9.520
9.490
The Central Gaps scanner detects the formation of a bearish gap marking the strong presence of sellers ahead of buyers at the opening. This formed a quotation gap.
Opening Gap DOWN
Type : Bearish
Timeframe : Openning
A study of price movements over other periods shows the following variations:
Near a new LOW record (5 years)
Type : Bearish
Timeframe : Weekly
Near a new LOW record (1 year)
Type : Bearish
Timeframe : Weekly
Near a new LOW record (1st january)
Type : Bearish
Timeframe : Weekly
Near a new LOW record (1 month)
Type : Bearish
Timeframe : Weekly
The Central Volumes scanner detects abnormal volumes on the asset:
Abnormal volumes
Timeframe : 20 days
Technical
A technical analysis in 1H of this SALVATORE FERRAGAMO chart shows a strongly bullish trend. The signals given by the moving averages are 85.71% bullish. This strong bullish trend is confirmed by the strong signals currently being given by short-term moving averages. There is no crossing of moving average by the price or crossing of moving averages between themselves.
The technical indicators are bullish. There is still some doubt about the price increase.
But beware of excesses. The Central Indicators scanner currently detects this:
Williams %R indicator is overbought : over -20
Type : Neutral
Timeframe : 1 hour
Pivot points : price is over resistance 1
Type : Neutral
Timeframe : 1 hour
An analysis of the price chart with the Central Patterns scanner (detector of chart patterns and resistances and supports) shows a result that can have an impact on the price change:
Near resistance of channel
Type : Bearish
Timeframe : 1 hour
The Central Candlesticks scanner which studies Japanese candlesticks did not detect anything.
ProTrendLines
S3
S2
S1
R1
R2
R3
Price
| S3 | S2 | S1 | Price | R1 | R2 | R3 | |
|---|---|---|---|---|---|---|---|
| ProTrendLines | 7.466 | 9.035 | 9.300 | 9.490 | 9.695 | 10.560 | 10.923 |
| Change (%) | -21.33% | -4.79% | -2.00% | - | +2.16% | +11.28% | +15.10% |
| Change | -2.024 | -0.455 | -0.190 | - | +0.205 | +1.070 | +1.433 |
| Level | Intermediate | Major | Minor | - | Major | Major | Intermediate |
To determine price objectives, it is also possible to use the pivot points. Here is the price position in relation to pivot points:
Daily
| Pivot points | S3 | S2 | S1 | PP | R1 | R2 | R3 |
|---|---|---|---|---|---|---|---|
| Standard | 9.075 | 9.190 | 9.260 | 9.375 | 9.445 | 9.560 | 9.630 |
| Camarilla | 9.279 | 9.296 | 9.313 | 9.330 | 9.347 | 9.364 | 9.381 |
| Woodie | 9.053 | 9.179 | 9.238 | 9.364 | 9.423 | 9.549 | 9.608 |
| Fibonacci | 9.190 | 9.261 | 9.304 | 9.375 | 9.446 | 9.489 | 9.560 |
Weekly
| Pivot points | S3 | S2 | S1 | PP | R1 | R2 | R3 |
|---|---|---|---|---|---|---|---|
| Standard | 8.562 | 8.763 | 9.142 | 9.343 | 9.722 | 9.923 | 10.302 |
| Camarilla | 9.361 | 9.414 | 9.467 | 9.520 | 9.573 | 9.626 | 9.680 |
| Woodie | 8.650 | 8.808 | 9.230 | 9.388 | 9.810 | 9.968 | 10.390 |
| Fibonacci | 8.763 | 8.985 | 9.122 | 9.343 | 9.565 | 9.702 | 9.923 |
Monthly
| Pivot points | S3 | S2 | S1 | PP | R1 | R2 | R3 |
|---|---|---|---|---|---|---|---|
| Standard | 6.087 | 7.523 | 8.427 | 9.863 | 10.767 | 12.203 | 13.107 |
| Camarilla | 8.687 | 8.901 | 9.116 | 9.330 | 9.545 | 9.759 | 9.974 |
| Woodie | 5.820 | 7.390 | 8.160 | 9.730 | 10.500 | 12.070 | 12.840 |
| Fibonacci | 7.523 | 8.417 | 8.970 | 9.863 | 10.757 | 11.310 | 12.203 |
Numerical data
The following are the details of the technical indicators and moving averages that were collected to generate this technical analysis:
Technical indicators
Moving averages
| RSI (14): | 56.01 | |
| MACD (12,26,9): | 0.0260 | |
| Directional Movement: | 3.765 | |
| AROON (14): | 21.429 | |
| DEMA (21): | 9.458 | |
| Parabolic SAR (0,02-0,02-0,2): | 9.303 | |
| Elder Ray (13): | 0.016 | |
| Super Trend (3,10): | 9.523 | |
| Zig ZAG (10): | 9.475 | |
| VORTEX (21): | 1.0000 | |
| Stochastique (14,3,5): | 78.01 | |
| TEMA (21): | 9.455 | |
| Williams %R (14): | -17.02 | |
| Chande Momentum Oscillator (20): | 0.095 | |
| Repulse (5,40,3): | 0.1960 | |
| ROCnROLL: | 1 | |
| TRIX (15,9): | 0.0290 | |
| Courbe Coppock: | 0.95 |
| MA7: | 9.359 | |
| MA20: | 9.628 | |
| MA50: | 10.901 | |
| MA100: | 11.387 | |
| MAexp7: | 9.456 | |
| MAexp20: | 9.424 | |
| MAexp50: | 9.376 | |
| MAexp100: | 9.432 | |
| Price / MA7: | +1.40% | |
| Price / MA20: | -1.43% | |
| Price / MA50: | -12.94% | |
| Price / MA100: | -16.66% | |
| Price / MAexp7: | +0.36% | |
| Price / MAexp20: | +0.70% | |
| Price / MAexp50: | +1.22% | |
| Price / MAexp100: | +0.61% |
Quotes :
-
15 min delayed data
-
Actions Italie
News
Don't forget to follow the news on SALVATORE FERRAGAMO. At the time of publication of this analysis, the latest news was as follows:
- Salvatore Ferragamo and Medallia Together Amplify the Customer Experience
- Amazon and Salvatore Ferragamo File Two Joint Lawsuits Against Counterfeiters
- Salvatore Ferragamo Embarks on Centric PLM Journey
- Salvatore Ferragamo of Il Borro Wines to Host Admiral Travel Charter of Crystal Skye Boeing 777 Private Jet
-
 Salvatore Ferragamo