ERG - Daily - Technical analysis published on 10/13/2019 (GMT)
- 230
- 0
- Who voted?
- Timeframe : Daily
- - Analysis generated on
- Status : NEUTRAL
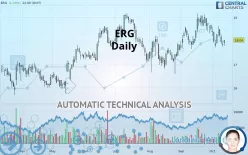

Summary of the analysis

Additional analysis
Quotes
The ERG price is 18.04 EUR. The price has increased by +1.24% since the last closing and was between 17.79 EUR and 18.04 EUR. This implies that the price is at +1.41% from its lowest and at 0% from its highest.A bearish gap was detected at the opening by the Central Gaps scanner. There are a lot of sellers and they have the upper hand in the very short term.
Opening Gap DOWN
Type : Bearish
Timeframe : Openning
So that you have an overall view of the price change, here is a table showing the variations over several periods:
Near a new LOW record (1 month)
Type : Bearish
Timeframe : Weekly
Technical
Technical analysis of ERG in Daily shows an overall slightly bullish trend. 60.71% of the signals given by moving averages are bullish. As the signals currently given by short-term moving averages are rather neutral, the slightly bullish trend could return to neutral. The Central Indicators market scanner currently does not detect any result that concerns moving averages.
The probability of a further decline is moderate given the direction of the technical indicators.
Other results related to technical indicators were also found by the Central Indicators scanner:
Pivot points : price is under support 3
Type : Neutral
Timeframe : Daily
RSI indicator is back under 50
Type : Bearish
Timeframe : Daily
Price is back under the pivot point
Type : Bearish
Timeframe : Weekly
Central Patterns, the market scanner focusing on chart patterns, resistances and supports found this result:
Near horizontal support
Type : Bullish
Timeframe : Daily
The Central Candlesticks scanner which studies Japanese candlesticks did not detect anything.
| S3 | S2 | S1 | Price | R1 | R2 | R3 | |
|---|---|---|---|---|---|---|---|
| ProTrendLines | 16.56 | 16.90 | 17.59 | 18.04 | 18.07 | 18.35 | 18.60 |
| Change (%) | -8.20% | -6.32% | -2.49% | - | +0.17% | +1.72% | +3.10% |
| Change | -1.48 | -1.14 | -0.45 | - | +0.03 | +0.31 | +0.56 |
| Level | Minor | Major | Intermediate | - | Minor | Intermediate | Major |
Pivot points can also be used to set your price objectives. Here is the price situation in relation to pivot points:
| Pivot points | S3 | S2 | S1 | PP | R1 | R2 | R3 |
|---|---|---|---|---|---|---|---|
| Standard | 17.81 | 17.99 | 18.12 | 18.30 | 18.43 | 18.61 | 18.74 |
| Camarilla | 18.16 | 18.18 | 18.21 | 18.24 | 18.27 | 18.30 | 18.33 |
| Woodie | 17.78 | 17.98 | 18.09 | 18.29 | 18.40 | 18.60 | 18.71 |
| Fibonacci | 17.99 | 18.11 | 18.19 | 18.30 | 18.42 | 18.50 | 18.61 |
| Pivot points | S3 | S2 | S1 | PP | R1 | R2 | R3 |
|---|---|---|---|---|---|---|---|
| Standard | 17.42 | 17.88 | 18.22 | 18.68 | 19.02 | 19.48 | 19.82 |
| Camarilla | 18.35 | 18.42 | 18.50 | 18.57 | 18.64 | 18.72 | 18.79 |
| Woodie | 17.37 | 17.85 | 18.17 | 18.65 | 18.97 | 19.45 | 19.77 |
| Fibonacci | 17.88 | 18.18 | 18.37 | 18.68 | 18.98 | 19.17 | 19.48 |
| Pivot points | S3 | S2 | S1 | PP | R1 | R2 | R3 |
|---|---|---|---|---|---|---|---|
| Standard | 16.17 | 16.89 | 17.70 | 18.42 | 19.23 | 19.95 | 20.76 |
| Camarilla | 18.08 | 18.22 | 18.36 | 18.50 | 18.64 | 18.78 | 18.92 |
| Woodie | 16.21 | 16.91 | 17.74 | 18.44 | 19.27 | 19.97 | 20.80 |
| Fibonacci | 16.89 | 17.48 | 17.84 | 18.42 | 19.01 | 19.37 | 19.95 |
Numerical data
The following is the status of the technical indicators and moving averages at the time of publication of this technical analysis:
| RSI (14): | 44.08 | |
| MACD (12,26,9): | 0.0200 | |
| Directional Movement: | -3.73 | |
| AROON (14): | -50.00 | |
| DEMA (21): | 18.36 | |
| Parabolic SAR (0,02-0,02-0,2): | 17.76 | |
| Elder Ray (13): | -0.24 | |
| Super Trend (3,10): | 17.69 | |
| Zig ZAG (10): | 17.94 | |
| VORTEX (21): | 0.9800 | |
| Stochastique (14,3,5): | 32.39 | |
| TEMA (21): | 18.25 | |
| Williams %R (14): | -84.40 | |
| Chande Momentum Oscillator (20): | -0.70 | |
| Repulse (5,40,3): | -2.4100 | |
| ROCnROLL: | 2 | |
| TRIX (15,9): | 0.1000 | |
| Courbe Coppock: | 4.38 |
| MA7: | 18.15 | |
| MA20: | 18.45 | |
| MA50: | 17.97 | |
| MA100: | 17.98 | |
| MAexp7: | 18.20 | |
| MAexp20: | 18.28 | |
| MAexp50: | 18.13 | |
| MAexp100: | 17.89 | |
| Price / MA7: | -0.61% | |
| Price / MA20: | -2.22% | |
| Price / MA50: | +0.39% | |
| Price / MA100: | +0.33% | |
| Price / MAexp7: | -0.88% | |
| Price / MAexp20: | -1.31% | |
| Price / MAexp50: | -0.50% | |
| Price / MAexp100: | +0.84% |
News
The last news published on ERG at the time of the generation of this analysis was as follows:
 ERG
ERGAbout author

Online


Add a comment
Comments
0 comments on the analysis ERG - Daily