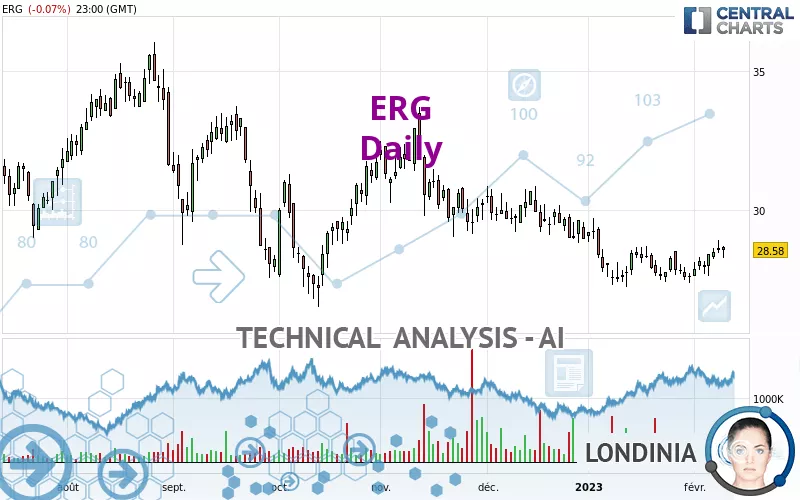
ERG - Daily - Technical analysis published on 02/09/2023 (GMT)
- 147
- 0
Click here for a new analysis!
- Timeframe : Daily
- - Analysis generated on
- Status : TARGET REACHED

Summary of the analysis

Additional analysis
Quotes
The ERG price is 28.58 EUR. The price registered a decrease of -0.07% on the session and was between 28.30 EUR and 28.72 EUR. This implies that the price is at +0.99% from its lowest and at -0.49% from its highest.The Central Gaps scanner detects a bullish opening. A small advantage for buyers in the very short term.
Bullish opening
Type : Bullish
Timeframe : Openning
A study of price movements over other periods shows the following variations:
Near a new LOW record (1st january)
Type : Bearish
Timeframe : Weekly
Near a new LOW record (1 month)
Type : Bearish
Timeframe : Weekly
Technical
Technical analysis of ERG in Daily shows an overall bearish trend. 71.43% of the signals given by moving averages are bearish. Caution: the neutral signals currently given by short-term moving averages show us that the global trend is losing momentum. The Central Indicators market scanner currently does not detect any result that concerns moving averages.
An assessment of technical indicators shows a moderate bullish signal.
But beware of excesses. The Central Indicators scanner currently detects this:
CCI indicator is overbought : over 100
Type : Neutral
Timeframe : Daily
Pivot points : price is over resistance 1
Type : Neutral
Timeframe : Weekly
Ichimoku - Bullish crossover : Tenkan & Kijun
Type : Bullish
Timeframe : Daily
Price is back under the pivot point
Type : Bearish
Timeframe : Daily
An analysis of the price chart with the Central Patterns scanner (detector of chart patterns and resistances and supports) shows a result that can have an impact on the price change:
Near horizontal support
Type : Bullish
Timeframe : Daily
The Central Candlesticks scanner which studies Japanese candlesticks did not detect anything.
| S3 | S2 | S1 | Price | R1 | R2 | R3 | |
|---|---|---|---|---|---|---|---|
| ProTrendLines | 26.42 | 27.58 | 28.30 | 28.58 | 29.24 | 30.70 | 31.40 |
| Change (%) | -7.56% | -3.50% | -0.98% | - | +2.31% | +7.42% | +9.87% |
| Change | -2.16 | -1.00 | -0.28 | - | +0.66 | +2.12 | +2.82 |
| Level | Major | Major | Minor | - | Intermediate | Minor | Major |
Pivot points can also be used to set your price objectives. Here is the price situation in relation to pivot points:
| Pivot points | S3 | S2 | S1 | PP | R1 | R2 | R3 |
|---|---|---|---|---|---|---|---|
| Standard | 27.95 | 28.21 | 28.41 | 28.67 | 28.87 | 29.13 | 29.33 |
| Camarilla | 28.47 | 28.52 | 28.56 | 28.60 | 28.64 | 28.68 | 28.73 |
| Woodie | 27.91 | 28.20 | 28.37 | 28.66 | 28.83 | 29.12 | 29.29 |
| Fibonacci | 28.21 | 28.39 | 28.50 | 28.67 | 28.85 | 28.96 | 29.13 |
| Pivot points | S3 | S2 | S1 | PP | R1 | R2 | R3 |
|---|---|---|---|---|---|---|---|
| Standard | 26.59 | 26.99 | 27.53 | 27.93 | 28.47 | 28.87 | 29.41 |
| Camarilla | 27.80 | 27.89 | 27.97 | 28.06 | 28.15 | 28.23 | 28.32 |
| Woodie | 26.65 | 27.03 | 27.59 | 27.97 | 28.53 | 28.91 | 29.47 |
| Fibonacci | 26.99 | 27.35 | 27.57 | 27.93 | 28.29 | 28.51 | 28.87 |
| Pivot points | S3 | S2 | S1 | PP | R1 | R2 | R3 |
|---|---|---|---|---|---|---|---|
| Standard | 24.19 | 25.71 | 26.69 | 28.21 | 29.19 | 30.71 | 31.69 |
| Camarilla | 26.97 | 27.20 | 27.43 | 27.66 | 27.89 | 28.12 | 28.35 |
| Woodie | 23.91 | 25.58 | 26.41 | 28.08 | 28.91 | 30.58 | 31.41 |
| Fibonacci | 25.71 | 26.67 | 27.26 | 28.21 | 29.17 | 29.76 | 30.71 |
Numerical data
The following is the status of the technical indicators and moving averages at the time of publication of this technical analysis:
| RSI (14): | 53.77 | |
| MACD (12,26,9): | -0.0800 | |
| Directional Movement: | 5.69 | |
| AROON (14): | 42.86 | |
| DEMA (21): | 28.05 | |
| Parabolic SAR (0,02-0,02-0,2): | 27.56 | |
| Elder Ray (13): | 0.28 | |
| Super Trend (3,10): | 29.24 | |
| Zig ZAG (10): | 28.52 | |
| VORTEX (21): | 1.0800 | |
| Stochastique (14,3,5): | 80.62 | |
| TEMA (21): | 28.32 | |
| Williams %R (14): | -27.27 | |
| Chande Momentum Oscillator (20): | 0.72 | |
| Repulse (5,40,3): | 0.8000 | |
| ROCnROLL: | -1 | |
| TRIX (15,9): | -0.1200 | |
| Courbe Coppock: | 1.83 |
| MA7: | 28.32 | |
| MA20: | 28.11 | |
| MA50: | 28.82 | |
| MA100: | 29.47 | |
| MAexp7: | 28.35 | |
| MAexp20: | 28.25 | |
| MAexp50: | 28.75 | |
| MAexp100: | 29.43 | |
| Price / MA7: | +0.92% | |
| Price / MA20: | +1.67% | |
| Price / MA50: | -0.83% | |
| Price / MA100: | -3.02% | |
| Price / MAexp7: | +0.81% | |
| Price / MAexp20: | +1.17% | |
| Price / MAexp50: | -0.59% | |
| Price / MAexp100: | -2.89% |
News
The last news published on ERG at the time of the generation of this analysis was as follows:
About author
Online


Add a comment
Comments
0 comments on the analysis ERG - Daily