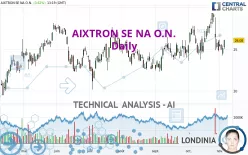
AIXTRON SE NA O.N. - Daily - Technical analysis published on 11/04/2022 (GMT)
- 217
- 0
Click here for a new analysis!
- Timeframe : Daily
- - Analysis generated on
- Status : TARGET REACHED

Summary of the analysis

Additional analysis
Quotes
The AIXTRON SE NA O.N. price is 26.08 EUR. The price registered an increase of +3.62% on the session and was between 25.06 EUR and 26.18 EUR. This implies that the price is at +4.07% from its lowest and at -0.38% from its highest.The Central Gaps scanner detects a bullish opening marking the presence of buyers ahead of sellers at the opening but not sufficiently marked to allow the price to register a quotation gap.
Bullish opening
Type : Bullish
Timeframe : Openning
A study of price movements over other periods shows the following variations:
Technical
A technical analysis in Daily of this AIXTRON SE NA O.N. chart shows a bullish trend. 75.00% of the signals given by moving averages are bullish. Caution: the neutral signals currently given by short-term moving averages show us that the global trend is losing momentum. An assessment of moving averages reveals several bullish signals that could impact this trend:
Bullish price crossover with Moving Average 50
Type : Bullish
Timeframe : Daily
Bullish price crossover with adaptative moving average 20
Type : Bullish
Timeframe : Daily
Bullish price crossover with adaptative moving average 50
Type : Bullish
Timeframe : Daily
In fact, Central Analyzer took into account 18 technical indicators and the result was as follows: 6 are bullish, 7 are neutral and 5 are bearish. Central Indicators, the scanner specialised in technical indicators, has identified these signals:
Pivot points : price is over resistance 1
Type : Neutral
Timeframe : Daily
RSI indicator is back over 50
Type : Bullish
Timeframe : Daily
The analysis of the price chart with Central Patterns scanners does not return any result.
The Central Candlesticks scanner, specialised in Japanese candlesticks, did not identify any signals.
| S3 | S2 | S1 | Price | R1 | R2 | R3 | |
|---|---|---|---|---|---|---|---|
| ProTrendLines | 21.18 | 22.64 | 24.57 | 26.08 | 26.77 | 27.90 | 29.37 |
| Change (%) | -18.79% | -13.19% | -5.79% | - | +2.65% | +6.98% | +12.62% |
| Change | -4.90 | -3.44 | -1.51 | - | +0.69 | +1.82 | +3.29 |
| Level | Intermediate | Intermediate | Major | - | Minor | Major | Major |
Attention could also be paid to pivot points to set price objectives:
| Pivot points | S3 | S2 | S1 | PP | R1 | R2 | R3 |
|---|---|---|---|---|---|---|---|
| Standard | 23.28 | 23.78 | 24.47 | 24.97 | 25.66 | 26.16 | 26.85 |
| Camarilla | 24.84 | 24.95 | 25.06 | 25.17 | 25.28 | 25.39 | 25.50 |
| Woodie | 23.39 | 23.83 | 24.58 | 25.02 | 25.77 | 26.21 | 26.96 |
| Fibonacci | 23.78 | 24.23 | 24.51 | 24.97 | 25.42 | 25.70 | 26.16 |
| Pivot points | S3 | S2 | S1 | PP | R1 | R2 | R3 |
|---|---|---|---|---|---|---|---|
| Standard | 19.20 | 22.05 | 23.67 | 26.52 | 28.14 | 30.99 | 32.61 |
| Camarilla | 24.06 | 24.47 | 24.88 | 25.29 | 25.70 | 26.11 | 26.52 |
| Woodie | 18.59 | 21.74 | 23.06 | 26.21 | 27.53 | 30.68 | 32.00 |
| Fibonacci | 22.05 | 23.76 | 24.81 | 26.52 | 28.23 | 29.28 | 30.99 |
| Pivot points | S3 | S2 | S1 | PP | R1 | R2 | R3 |
|---|---|---|---|---|---|---|---|
| Standard | 16.80 | 20.21 | 22.55 | 25.96 | 28.30 | 31.71 | 34.05 |
| Camarilla | 23.31 | 23.84 | 24.36 | 24.89 | 25.42 | 25.94 | 26.47 |
| Woodie | 16.27 | 19.94 | 22.02 | 25.69 | 27.77 | 31.44 | 33.52 |
| Fibonacci | 20.21 | 22.41 | 23.76 | 25.96 | 28.16 | 29.51 | 31.71 |
Numerical data
The following is the status of the technical indicators and moving averages at the time of publication of this technical analysis:
| RSI (14): | 50.69 | |
| MACD (12,26,9): | 0.0300 | |
| Directional Movement: | -3.36 | |
| AROON (14): | -50.00 | |
| DEMA (21): | 26.30 | |
| Parabolic SAR (0,02-0,02-0,2): | 28.46 | |
| Elder Ray (13): | -0.49 | |
| Super Trend (3,10): | 29.03 | |
| Zig ZAG (10): | 26.15 | |
| VORTEX (21): | 0.8900 | |
| Stochastique (14,3,5): | 21.33 | |
| TEMA (21): | 25.94 | |
| Williams %R (14): | -64.12 | |
| Chande Momentum Oscillator (20): | -0.99 | |
| Repulse (5,40,3): | 3.7300 | |
| ROCnROLL: | 1 | |
| TRIX (15,9): | 0.1900 | |
| Courbe Coppock: | 0.06 |
| MA7: | 25.48 | |
| MA20: | 26.27 | |
| MA50: | 25.37 | |
| MA100: | 24.83 | |
| MAexp7: | 25.84 | |
| MAexp20: | 26.12 | |
| MAexp50: | 25.65 | |
| MAexp100: | 24.89 | |
| Price / MA7: | +2.35% | |
| Price / MA20: | -0.72% | |
| Price / MA50: | +2.80% | |
| Price / MA100: | +5.03% | |
| Price / MAexp7: | +0.93% | |
| Price / MAexp20: | -0.15% | |
| Price / MAexp50: | +1.68% | |
| Price / MAexp100: | +4.78% |
News
Don't forget to follow the news on AIXTRON SE NA O.N.. At the time of publication of this analysis, the latest news was as follows:
- EQS-News: AIXTRON upgrades 2022 growth guidance based on strong order situation/ New G10-SiC system already largest driver of orders in the quarter / Gross margin increased due to improved product mix
- Furukawa in Japan selects AIXTRONs MOCVD technology for the production of optoelectronic devices / AIXTRON to support development of GaAs and InP based optoelectronics in Japan
- AIXTRON launches next Generation G10-SiC 200 mm product solution for Silicon Carbide Epitaxy
- DGAP-News: AIXTRON: Continuing growth path / Highest order intake since 2011 / First volume order for Micro LED / SiC and GaN biggest drivers / revenue and profit improved / Growth guidance for 2022 confirmed
- AIXTRON CCS MOCVD system to be delivered to The University of Texas at Austin for Gallium Oxide Power devices / AIXTRON supports Top-US-University with advanced MOCVD System for R&D
About author
Online


Add a comment
Comments
0 comments on the analysis AIXTRON SE NA O.N. - Daily