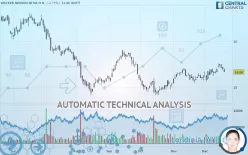
WACKER NEUSON SE NA O.N. - Daily - Technical analysis published on 12/19/2019 (GMT)
- 264
- 0
- Who voted?
Click here for a new analysis!
- Timeframe : Daily
- - Analysis generated on
- Status : INVALID

Summary of the analysis

Additional analysis
Quotes
WACKER NEUSON SE NA O.N. rating 16.66 EUR. The price is lower by -1.77% since the last closing and was traded between 16.66 EUR and 17.05 EUR over the period. The price is currently at 0% from its lowest and -2.29% from its highest.The Central Gaps scanner detects a bearish opening. A small advantage for sellers in the very short term.
Bearish opening
Type : Bearish
Timeframe : Openning
Here is a more detailed summary of the historical variations registered by WACKER NEUSON SE NA O.N.:
Near a new HIGH record (1 month)
Type : Bullish
Timeframe : Weekly
Technical
A technical analysis in Daily of this WACKER NEUSON SE NA O.N. chart shows a slightly bullish trend. 57.14% of the signals given by moving averages are bullish. The overall trend could accelerate as strong bullish signals from short-term moving averages are expected. There is no crossing of moving average by the price or crossing of moving averages between themselves.
On the 18 technical indicators analysed, 7 are bullish, 7 are neutral and 4 are bearish. Caution: the Central Indicators scanner currently detects an excess:
Williams %R indicator is overbought : over -20
Type : Neutral
Timeframe : Daily
Pivot points : price is under support 1
Type : Neutral
Timeframe : Daily
Price is back over the pivot point
Type : Bullish
Timeframe : Weekly
Central Patterns, the market scanner focusing on chart patterns, resistances and supports found this result:
Near resistance of channel
Type : Bearish
Timeframe : Daily
The Central Candlesticks scanner, specialised in Japanese candlesticks, did not identify any signals.
| S3 | S2 | S1 | Price | R1 | R2 | R3 | |
|---|---|---|---|---|---|---|---|
| ProTrendLines | 13.47 | 14.36 | 16.32 | 16.66 | 18.97 | 21.06 | 22.64 |
| Change (%) | -19.15% | -13.81% | -2.04% | - | +13.87% | +26.41% | +35.89% |
| Change | -3.19 | -2.30 | -0.34 | - | +2.31 | +4.40 | +5.98 |
| Level | Major | Intermediate | Major | - | Intermediate | Minor | Minor |
To determine price objectives, it is also possible to use the pivot points. Here is the price position in relation to pivot points:
| Pivot points | S3 | S2 | S1 | PP | R1 | R2 | R3 |
|---|---|---|---|---|---|---|---|
| Standard | 16.41 | 16.61 | 16.79 | 16.99 | 17.17 | 17.37 | 17.55 |
| Camarilla | 16.86 | 16.89 | 16.93 | 16.96 | 17.00 | 17.03 | 17.07 |
| Woodie | 16.39 | 16.61 | 16.77 | 16.99 | 17.15 | 17.37 | 17.53 |
| Fibonacci | 16.61 | 16.76 | 16.85 | 16.99 | 17.14 | 17.23 | 17.37 |
| Pivot points | S3 | S2 | S1 | PP | R1 | R2 | R3 |
|---|---|---|---|---|---|---|---|
| Standard | 14.97 | 15.58 | 16.40 | 17.01 | 17.83 | 18.44 | 19.26 |
| Camarilla | 16.84 | 16.97 | 17.10 | 17.23 | 17.36 | 17.49 | 17.62 |
| Woodie | 15.09 | 15.63 | 16.52 | 17.06 | 17.95 | 18.49 | 19.38 |
| Fibonacci | 15.58 | 16.12 | 16.46 | 17.01 | 17.55 | 17.89 | 18.44 |
| Pivot points | S3 | S2 | S1 | PP | R1 | R2 | R3 |
|---|---|---|---|---|---|---|---|
| Standard | 13.62 | 14.52 | 15.34 | 16.24 | 17.06 | 17.96 | 18.78 |
| Camarilla | 15.69 | 15.85 | 16.00 | 16.16 | 16.32 | 16.48 | 16.63 |
| Woodie | 13.58 | 14.50 | 15.30 | 16.22 | 17.02 | 17.94 | 18.74 |
| Fibonacci | 14.52 | 15.18 | 15.58 | 16.24 | 16.90 | 17.30 | 17.96 |
Numerical data
The following is the status of technical indicators and moving averages registered at the time this technical analysis was created:
| RSI (14): | 52.59 | |
| MACD (12,26,9): | 0.2600 | |
| Directional Movement: | 2.35 | |
| AROON (14): | 57.14 | |
| DEMA (21): | 16.97 | |
| Parabolic SAR (0,02-0,02-0,2): | 17.61 | |
| Elder Ray (13): | 0.07 | |
| Super Trend (3,10): | 15.88 | |
| Zig ZAG (10): | 16.71 | |
| VORTEX (21): | 1.0700 | |
| Stochastique (14,3,5): | 66.17 | |
| TEMA (21): | 17.12 | |
| Williams %R (14): | -44.78 | |
| Chande Momentum Oscillator (20): | 0.88 | |
| Repulse (5,40,3): | -3.8200 | |
| ROCnROLL: | -1 | |
| TRIX (15,9): | 0.2100 | |
| Courbe Coppock: | 10.82 |
| MA7: | 17.01 | |
| MA20: | 16.54 | |
| MA50: | 16.01 | |
| MA100: | 16.23 | |
| MAexp7: | 16.92 | |
| MAexp20: | 16.64 | |
| MAexp50: | 16.43 | |
| MAexp100: | 16.89 | |
| Price / MA7: | -2.06% | |
| Price / MA20: | +0.73% | |
| Price / MA50: | +4.06% | |
| Price / MA100: | +2.65% | |
| Price / MAexp7: | -1.54% | |
| Price / MAexp20: | +0.12% | |
| Price / MAexp50: | +1.40% | |
| Price / MAexp100: | -1.36% |
News
The last news published on WACKER NEUSON SE NA O.N. at the time of the generation of this analysis was as follows:
- DGAP-News: Wacker Neuson Group reports double-digit growth in the third quarter - profitability under pressure
- DGAP-Adhoc: The Wacker Neuson Group publishes preliminary figures for Q3/2019 and revises its forecast
- DGAP-News: The Wacker Neuson Group further sharpens its focus on core products and sells its concrete power trowel business
- DGAP-News: Wacker Neuson Group reports double-digit growth in the first half of the year - Revenue and earnings guidance confirmed
- DGAP-News: Wacker Neuson SE: Increase in Wacker Neuson SE free float
About author

Online


Add a comment
Comments
0 comments on the analysis WACKER NEUSON SE NA O.N. - Daily