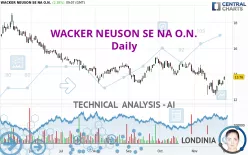
WACKER NEUSON SE NA O.N. - Daily - Technical analysis published on 11/29/2024 (GMT)
- 105
- 0
Click here for a new analysis!
- Timeframe : Daily
- - Analysis generated on
- Status : INVALID

Summary of the analysis

Additional analysis
Quotes
The WACKER NEUSON SE NA O.N. rating is 13.76 EUR. The price has increased by +2.38% since the last closing and was traded between 13.54 EUR and 13.82 EUR over the period. The price is currently at +1.62% from its lowest and -0.43% from its highest.The Central Gaps scanner detects the formation of a bullish gap marking the strong presence of buyers against sellers at the opening. This formed a quotation gap.
Opening Gap UP
Type : Bullish
Timeframe : Openning
Here is a more detailed summary of the historical variations registered by WACKER NEUSON SE NA O.N.:
Technical
Technical analysis of this Daily chart of WACKER NEUSON SE NA O.N. indicates that the overall trend is bearish. 75.00% of the signals given by moving averages are bearish. Caution: as the signals currently given by short-term moving averages are rather neutral, the bearish trend could slow down. An assessment of moving averages reveals several bullish signals that could impact this trend:
Bullish price crossover with Moving Average 20
Type : Bullish
Timeframe : Daily
Bullish price crossover with adaptative moving average 20
Type : Bullish
Timeframe : Daily
In fact, according to the parameters integrated into the Central Analyzer system, 11 technical indicators out of 18 analysed are currently bullish. Caution: the Central Indicators scanner currently detects an excess:
Williams %R indicator is overbought : over -20
Type : Neutral
Timeframe : Daily
Pivot points : price is over resistance 2
Type : Neutral
Timeframe : Daily
RSI indicator is back over 50
Type : Bullish
Timeframe : Daily
Momentum indicator is back over 0
Type : Bullish
Timeframe : Daily
An analysis of the price chart with the Central Patterns scanner (detector of chart patterns and resistances and supports) shows a result that can have an impact on the price change:
Near resistance of channel
Type : Bearish
Timeframe : Daily
For a small rebound in the very short term, the Central Candlesticks scanner currently notes the presence of this bullish pattern in Japanese candlesticks:
Upside gap
Type : Bullish
Timeframe : Daily
| S3 | S2 | S1 | Price | R1 | R2 | R3 | |
|---|---|---|---|---|---|---|---|
| ProTrendLines | 10.80 | 12.52 | 13.30 | 13.76 | 14.44 | 14.93 | 16.48 |
| Change (%) | -21.51% | -9.01% | -3.34% | - | +4.94% | +8.50% | +19.77% |
| Change | -2.96 | -1.24 | -0.46 | - | +0.68 | +1.17 | +2.72 |
| Level | Major | Major | Major | - | Major | Major | Minor |
Pivot points can also be used to set your price objectives. Here is the price situation in relation to pivot points:
| Pivot points | S3 | S2 | S1 | PP | R1 | R2 | R3 |
|---|---|---|---|---|---|---|---|
| Standard | 12.93 | 13.05 | 13.25 | 13.37 | 13.57 | 13.69 | 13.89 |
| Camarilla | 13.35 | 13.38 | 13.41 | 13.44 | 13.47 | 13.50 | 13.53 |
| Woodie | 12.96 | 13.07 | 13.28 | 13.39 | 13.60 | 13.71 | 13.92 |
| Fibonacci | 13.05 | 13.18 | 13.25 | 13.37 | 13.50 | 13.57 | 13.69 |
| Pivot points | S3 | S2 | S1 | PP | R1 | R2 | R3 |
|---|---|---|---|---|---|---|---|
| Standard | 11.23 | 11.79 | 12.41 | 12.97 | 13.59 | 14.15 | 14.77 |
| Camarilla | 12.72 | 12.82 | 12.93 | 13.04 | 13.15 | 13.26 | 13.37 |
| Woodie | 11.27 | 11.81 | 12.45 | 12.99 | 13.63 | 14.17 | 14.81 |
| Fibonacci | 11.79 | 12.24 | 12.52 | 12.97 | 13.42 | 13.70 | 14.15 |
| Pivot points | S3 | S2 | S1 | PP | R1 | R2 | R3 |
|---|---|---|---|---|---|---|---|
| Standard | 12.55 | 13.23 | 13.69 | 14.37 | 14.83 | 15.51 | 15.97 |
| Camarilla | 13.85 | 13.95 | 14.06 | 14.16 | 14.27 | 14.37 | 14.47 |
| Woodie | 12.45 | 13.18 | 13.59 | 14.32 | 14.73 | 15.46 | 15.87 |
| Fibonacci | 13.23 | 13.66 | 13.93 | 14.37 | 14.80 | 15.07 | 15.51 |
Numerical data
The following is the status of the technical indicators and moving averages at the time of publication of this technical analysis:
| RSI (14): | 52.17 | |
| MACD (12,26,9): | -0.2300 | |
| Directional Movement: | 0.34 | |
| AROON (14): | -57.14 | |
| DEMA (21): | 13.16 | |
| Parabolic SAR (0,02-0,02-0,2): | 12.43 | |
| Elder Ray (13): | 0.30 | |
| Super Trend (3,10): | 14.01 | |
| Zig ZAG (10): | 13.76 | |
| VORTEX (21): | 0.9200 | |
| Stochastique (14,3,5): | 61.97 | |
| TEMA (21): | 13.12 | |
| Williams %R (14): | -18.39 | |
| Chande Momentum Oscillator (20): | 0.18 | |
| Repulse (5,40,3): | 4.1100 | |
| ROCnROLL: | -1 | |
| TRIX (15,9): | -0.3300 | |
| Courbe Coppock: | 9.38 |
| MA7: | 13.28 | |
| MA20: | 13.47 | |
| MA50: | 14.14 | |
| MA100: | 14.17 | |
| MAexp7: | 13.38 | |
| MAexp20: | 13.49 | |
| MAexp50: | 13.89 | |
| MAexp100: | 14.35 | |
| Price / MA7: | +3.61% | |
| Price / MA20: | +2.15% | |
| Price / MA50: | -2.69% | |
| Price / MA100: | -2.89% | |
| Price / MAexp7: | +2.84% | |
| Price / MAexp20: | +2.00% | |
| Price / MAexp50: | -0.94% | |
| Price / MAexp100: | -4.11% |
News
The latest news and videos published on WACKER NEUSON SE NA O.N. at the time of the analysis were as follows:
- EQS-News: Wacker Neuson Group publishes nine month figures – Focus on measures to increase profitability in 2025
- EQS-News: Wacker Neuson Group publishes half-year report and confirms preliminary figures for the first half of 2024
- EQS-News: Wacker Neuson Group: half-year 2024 results lower due to weak market compared to previous year – revised guidance for the fiscal year 2024
- EQS-Adhoc: Wacker Neuson SE revises the guidance for the fiscal year 2024 and publishes preliminary business figures for the first half of 2024
- EQS-News: Wacker Neuson Group opens new distribution center in Mülheim-Kärlich
About author
Online


Add a comment
Comments
0 comments on the analysis WACKER NEUSON SE NA O.N. - Daily