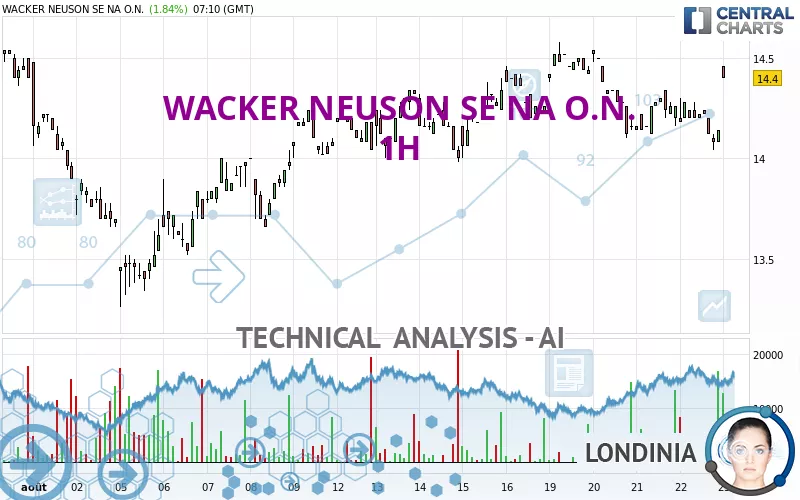
WACKER NEUSON SE NA O.N. - 1H - Technical analysis published on 08/23/2024 (GMT)
- 152
- 0
Click here for a new analysis!
- Timeframe : 1H
- - Analysis generated on
- Status : TARGET REACHED
Summary of the analysis

Additional analysis
Quotes
WACKER NEUSON SE NA O.N. rating 14.40 EUR. The price has increased by +1.84% since the last closing and was traded between 14.40 EUR and 14.46 EUR over the period. The price is currently at 0% from its lowest and -0.41% from its highest.The Central Gaps scanner detects the formation of a bullish gap marking the strong presence of buyers against sellers at the opening. This formed a quotation gap.
Opening Gap UP
Type : Bullish
Timeframe : Openning
So that you have an overall view of the price change, here is a table showing the variations over several periods:
Near a new HIGH record (1 month)
Type : Bullish
Timeframe : Weekly
Technical
Technical analysis of WACKER NEUSON SE NA O.N. in 1H shows a strongly overall bullish trend. The signals given by the moving averages are 85.71% bullish. This strong bullish trend is confirmed by the strong signals currently being given by short-term moving averages. The Central Indicators market scanner is currently detecting several bullish signals that could impact this trend:
Bullish price crossover with Moving Average 20
Type : Bullish
Timeframe : 1 hour
Bullish price crossover with Moving Average 50
Type : Bullish
Timeframe : 1 hour
Bullish price crossover with Moving Average 100
Type : Bullish
Timeframe : 1 hour
Bullish price crossover with adaptative moving average 20
Type : Bullish
Timeframe : 1 hour
Bullish price crossover with adaptative moving average 50
Type : Bullish
Timeframe : 1 hour
An assessment of technical indicators shows a slightly bullish signal.
But beware of excesses. The Central Indicators scanner currently detects this:
CCI indicator is overbought : over 100
Type : Neutral
Timeframe : 1 hour
MACD indicator: bullish divergence
Type : Bullish
Timeframe : 1 hour
Williams %R indicator is overbought : over -20
Type : Neutral
Timeframe : 1 hour
Pivot points : price is over resistance 1
Type : Neutral
Timeframe : 1 hour
RSI indicator is back over 50
Type : Bullish
Timeframe : 1 hour
MACD crosses UP its Moving Average
Type : Bullish
Timeframe : 1 hour
Parabolic SAR indicator bullish reversal
Type : Bullish
Timeframe : 1 hour
Aroon indicator bullish trend
Type : Bullish
Timeframe : 1 hour
SuperTrend indicator bullish reversal
Type : Bullish
Timeframe : 1 hour
Momentum indicator is back over 0
Type : Bullish
Timeframe : 1 hour
The Central Patterns scanner, which studies chart patterns, resistances and supports, has identified this signal:
Near support of channel
Type : Bullish
Timeframe : 1 hour
The Central Candlesticks scanner which studies Japanese candlesticks did not detect anything.
| S3 | S2 | S1 | Price | R1 | R2 | R3 | |
|---|---|---|---|---|---|---|---|
| ProTrendLines | 13.62 | 14.00 | 14.34 | 14.40 | 14.44 | 14.58 | 14.90 |
| Change (%) | -5.42% | -2.78% | -0.42% | - | +0.28% | +1.25% | +3.47% |
| Change | -0.78 | -0.40 | -0.06 | - | +0.04 | +0.18 | +0.50 |
| Level | Major | Intermediate | Intermediate | - | Intermediate | Minor | Minor |
To determine price objectives, it is also possible to use the pivot points. Here is the price position in relation to pivot points:
| Pivot points | S3 | S2 | S1 | PP | R1 | R2 | R3 |
|---|---|---|---|---|---|---|---|
| Standard | 13.76 | 13.90 | 14.02 | 14.16 | 14.28 | 14.42 | 14.54 |
| Camarilla | 14.07 | 14.09 | 14.12 | 14.14 | 14.16 | 14.19 | 14.21 |
| Woodie | 13.75 | 13.90 | 14.01 | 14.16 | 14.27 | 14.42 | 14.53 |
| Fibonacci | 13.90 | 14.00 | 14.06 | 14.16 | 14.26 | 14.32 | 14.42 |
| Pivot points | S3 | S2 | S1 | PP | R1 | R2 | R3 |
|---|---|---|---|---|---|---|---|
| Standard | 13.53 | 13.75 | 14.01 | 14.23 | 14.49 | 14.71 | 14.97 |
| Camarilla | 14.13 | 14.17 | 14.22 | 14.26 | 14.30 | 14.35 | 14.39 |
| Woodie | 13.54 | 13.76 | 14.02 | 14.24 | 14.50 | 14.72 | 14.98 |
| Fibonacci | 13.75 | 13.94 | 14.05 | 14.23 | 14.42 | 14.53 | 14.71 |
| Pivot points | S3 | S2 | S1 | PP | R1 | R2 | R3 |
|---|---|---|---|---|---|---|---|
| Standard | 12.15 | 13.11 | 13.75 | 14.71 | 15.35 | 16.31 | 16.95 |
| Camarilla | 13.96 | 14.11 | 14.25 | 14.40 | 14.55 | 14.69 | 14.84 |
| Woodie | 12.00 | 13.03 | 13.60 | 14.63 | 15.20 | 16.23 | 16.80 |
| Fibonacci | 13.11 | 13.72 | 14.10 | 14.71 | 15.32 | 15.70 | 16.31 |
Numerical data
The following are the details of the technical indicators and moving averages that were collected to generate this technical analysis:
| RSI (14): | 59.75 | |
| MACD (12,26,9): | -0.0200 | |
| Directional Movement: | 16.01 | |
| AROON (14): | 14.29 | |
| DEMA (21): | 14.20 | |
| Parabolic SAR (0,02-0,02-0,2): | 14.04 | |
| Elder Ray (13): | 0.21 | |
| Super Trend (3,10): | 14.14 | |
| Zig ZAG (10): | 14.40 | |
| VORTEX (21): | 0.8900 | |
| Stochastique (14,3,5): | 44.13 | |
| TEMA (21): | 14.19 | |
| Williams %R (14): | -14.29 | |
| Chande Momentum Oscillator (20): | 0.16 | |
| Repulse (5,40,3): | -0.5000 | |
| ROCnROLL: | 1 | |
| TRIX (15,9): | -0.0300 | |
| Courbe Coppock: | 0.20 |
| MA7: | 14.29 | |
| MA20: | 14.12 | |
| MA50: | 14.71 | |
| MA100: | 15.91 | |
| MAexp7: | 14.22 | |
| MAexp20: | 14.23 | |
| MAexp50: | 14.25 | |
| MAexp100: | 14.22 | |
| Price / MA7: | +0.77% | |
| Price / MA20: | +1.98% | |
| Price / MA50: | -2.11% | |
| Price / MA100: | -9.49% | |
| Price / MAexp7: | +1.27% | |
| Price / MAexp20: | +1.19% | |
| Price / MAexp50: | +1.05% | |
| Price / MAexp100: | +1.27% |
News
The last news published on WACKER NEUSON SE NA O.N. at the time of the generation of this analysis was as follows:
- EQS-News: Wacker Neuson Group publishes half-year report and confirms preliminary figures for the first half of 2024
- EQS-News: Wacker Neuson Group: half-year 2024 results lower due to weak market compared to previous year – revised guidance for the fiscal year 2024
- EQS-Adhoc: Wacker Neuson SE revises the guidance for the fiscal year 2024 and publishes preliminary business figures for the first half of 2024
- EQS-News: Wacker Neuson Group opens new distribution center in Mülheim-Kärlich
- EQS-News: Wacker Neuson SE Annual General Meeting approves dividend increase
About author
Online


Add a comment
Comments
0 comments on the analysis WACKER NEUSON SE NA O.N. - 1H