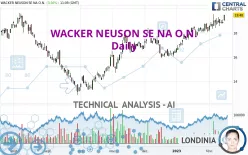
WACKER NEUSON SE NA O.N. - Daily - Technical analysis published on 02/15/2023 (GMT)
- 211
- 0
Click here for a new analysis!
- Timeframe : Daily
- - Analysis generated on
- Status : TARGET REACHED

Summary of the analysis

Additional analysis
Quotes
WACKER NEUSON SE NA O.N. rating 19.48 EUR. On the day, this instrument gained +3.56% and was traded between 18.99 EUR and 19.48 EUR over the period. The price is currently at +2.58% from its lowest and 0% from its highest.The Central Gaps scanner detects a bullish opening marking the presence of buyers ahead of sellers at the opening but not sufficiently marked to allow the price to register a quotation gap.
Bullish opening
Type : Bullish
Timeframe : Openning
So that you have an overall view of the price change, here is a table showing the variations over several periods:
Near a new HIGH record (1st january)
Type : Bullish
Timeframe : Weekly
Near a new HIGH record (1 month)
Type : Bullish
Timeframe : Weekly
Technical
A technical analysis in Daily of this WACKER NEUSON SE NA O.N. chart shows a strongly bullish trend. 92.86% of the signals given by moving averages are bullish. This strongly bullish trend is supported by the strong bullish signals given by short-term moving averages. The Central Indicators scanner does not detect any result on moving averages that would impact this trend.
The probability of a further increase is high given the direction of the technical indicators.
Caution: the Central Indicators scanner currently detects an excess:
CCI indicator is overbought : over 100
Type : Neutral
Timeframe : Daily
Williams %R indicator is overbought : over -20
Type : Neutral
Timeframe : Daily
Pivot points : price is over resistance 1
Type : Neutral
Timeframe : Weekly
Pivot points : price is over resistance 3
Type : Neutral
Timeframe : Daily
MACD crosses UP its Moving Average
Type : Bullish
Timeframe : Daily
An analysis of the price chart with the Central Patterns scanner (detector of chart patterns and resistances and supports) shows several results that can have an impact on the price change:
Near horizontal resistance
Type : Bearish
Timeframe : Daily
Near resistance of channel
Type : Bearish
Timeframe : Daily
Near resistance of triangle
Type : Bearish
Timeframe : Daily
The Central Candlesticks scanner which studies Japanese candlesticks did not detect anything.
| S3 | S2 | S1 | Price | R1 | R2 | R3 | |
|---|---|---|---|---|---|---|---|
| ProTrendLines | 15.62 | 18.12 | 19.42 | 19.48 | 20.50 | 21.24 | 24.10 |
| Change (%) | -19.82% | -6.98% | -0.31% | - | +5.24% | +9.03% | +23.72% |
| Change | -3.86 | -1.36 | -0.06 | - | +1.02 | +1.76 | +4.62 |
| Level | Major | Major | Major | - | Minor | Major | Minor |
Attention could also be paid to pivot points to set price objectives:
| Pivot points | S3 | S2 | S1 | PP | R1 | R2 | R3 |
|---|---|---|---|---|---|---|---|
| Standard | 18.36 | 18.57 | 18.69 | 18.90 | 19.02 | 19.23 | 19.35 |
| Camarilla | 18.72 | 18.75 | 18.78 | 18.81 | 18.84 | 18.87 | 18.90 |
| Woodie | 18.32 | 18.55 | 18.65 | 18.88 | 18.98 | 19.21 | 19.31 |
| Fibonacci | 18.57 | 18.70 | 18.77 | 18.90 | 19.03 | 19.10 | 19.23 |
| Pivot points | S3 | S2 | S1 | PP | R1 | R2 | R3 |
|---|---|---|---|---|---|---|---|
| Standard | 17.21 | 17.81 | 18.32 | 18.92 | 19.43 | 20.03 | 20.54 |
| Camarilla | 18.52 | 18.62 | 18.72 | 18.82 | 18.92 | 19.02 | 19.13 |
| Woodie | 17.16 | 17.79 | 18.27 | 18.90 | 19.38 | 20.01 | 20.49 |
| Fibonacci | 17.81 | 18.24 | 18.50 | 18.92 | 19.35 | 19.61 | 20.03 |
| Pivot points | S3 | S2 | S1 | PP | R1 | R2 | R3 |
|---|---|---|---|---|---|---|---|
| Standard | 14.25 | 15.29 | 16.72 | 17.76 | 19.19 | 20.23 | 21.66 |
| Camarilla | 17.46 | 17.69 | 17.91 | 18.14 | 18.37 | 18.59 | 18.82 |
| Woodie | 14.44 | 15.39 | 16.91 | 17.86 | 19.38 | 20.33 | 21.85 |
| Fibonacci | 15.29 | 16.24 | 16.82 | 17.76 | 18.71 | 19.29 | 20.23 |
Numerical data
The following is the status of technical indicators and moving averages registered at the time this technical analysis was created:
| RSI (14): | 67.05 | |
| MACD (12,26,9): | 0.3900 | |
| Directional Movement: | 15.71 | |
| AROON (14): | 28.57 | |
| DEMA (21): | 19.11 | |
| Parabolic SAR (0,02-0,02-0,2): | 18.44 | |
| Elder Ray (13): | 0.44 | |
| Super Trend (3,10): | 17.74 | |
| Zig ZAG (10): | 19.43 | |
| VORTEX (21): | 1.0300 | |
| Stochastique (14,3,5): | 66.44 | |
| TEMA (21): | 19.16 | |
| Williams %R (14): | -6.71 | |
| Chande Momentum Oscillator (20): | 1.07 | |
| Repulse (5,40,3): | 1.1000 | |
| ROCnROLL: | 1 | |
| TRIX (15,9): | 0.3200 | |
| Courbe Coppock: | 7.54 |
| MA7: | 18.93 | |
| MA20: | 18.58 | |
| MA50: | 17.67 | |
| MA100: | 16.61 | |
| MAexp7: | 18.96 | |
| MAexp20: | 18.58 | |
| MAexp50: | 17.89 | |
| MAexp100: | 17.38 | |
| Price / MA7: | +2.91% | |
| Price / MA20: | +4.84% | |
| Price / MA50: | +10.24% | |
| Price / MA100: | +17.28% | |
| Price / MAexp7: | +2.74% | |
| Price / MAexp20: | +4.84% | |
| Price / MAexp50: | +8.89% | |
| Price / MAexp100: | +12.08% |
News
Don't forget to follow the news on WACKER NEUSON SE NA O.N.. At the time of publication of this analysis, the latest news was as follows:
- EQS-News: Wacker Neuson continues to grow significantly in third quarter of 2022 and increases profitability
- DGAP-News: Wacker Neuson SE: Wacker Neuson reports strong growth in first half of 2022
- DGAP-News: Wacker Neuson SE: Wacker Neuson SE secures long-term financing with new credit lines and increases its financing flexibility
- DGAP-Adhoc: Wacker Neuson SE: Wacker Neuson expects EBIT for the second quarter to be above consensus; earnings guidance narrowed to the range between 9.0 and 10.0 percent
- DGAP-News: Wacker Neuson SE: Wacker Neuson strengthens Americas business through long-term agreement with John Deere for mini and compact excavators
About author
Online


Add a comment
Comments
0 comments on the analysis WACKER NEUSON SE NA O.N. - Daily