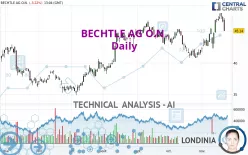
BECHTLE AG O.N. - Daily - Technical analysis published on 11/22/2023 (GMT)
- 214
- 0
Click here for a new analysis!
- Timeframe : Daily
- - Analysis generated on
- Status : INVALID

Summary of the analysis

Additional analysis
Quotes
The BECHTLE AG O.N. rating is 45.14 EUR. The price registered a decrease of -3.22% on the session and was between 45.06 EUR and 47.10 EUR. This implies that the price is at +0.18% from its lowest and at -4.16% from its highest.The Central Gaps scanner detects a bullish opening marking the presence of buyers ahead of sellers at the opening but not sufficiently marked to allow the price to register a quotation gap.
Bullish opening
Type : Bullish
Timeframe : Openning
Here is a more detailed summary of the historical variations registered by BECHTLE AG O.N.:
Near a new HIGH record (1 year)
Type : Bullish
Timeframe : Weekly
Near a new HIGH record (1st january)
Type : Bullish
Timeframe : Weekly
Near a new HIGH record (1 month)
Type : Bullish
Timeframe : Weekly
Technical
A technical analysis in Daily of this BECHTLE AG O.N. chart shows a strongly bullish trend. 92.86% of the signals given by moving averages are bullish. The overall trend is supported by the strong bullish signals from short-term moving averages. There is no crossing of moving average by the price or crossing of moving averages between themselves.
In fact, only 7 technical indicators out of 18 studied are currently bullish. Other results related to technical indicators were also found by the Central Indicators scanner:
Pivot points : price is under support 3
Type : Neutral
Timeframe : Daily
Parabolic SAR indicator bearish reversal
Type : Bearish
Timeframe : Daily
Price is back under the pivot point
Type : Bearish
Timeframe : Weekly
The Central Patterns scanner, which studies chart patterns, resistances and supports, has identified this signal:
Horizontal support is broken
Type : Bearish
Timeframe : Daily
No result was found by the Central Candlesticks scanner on Japanese candlesticks.
| S3 | S2 | S1 | Price | R1 | R2 | R3 | |
|---|---|---|---|---|---|---|---|
| ProTrendLines | 35.52 | 38.00 | 43.22 | 45.14 | 46.28 | 48.35 | 55.35 |
| Change (%) | -21.31% | -15.82% | -4.25% | - | +2.53% | +7.11% | +22.62% |
| Change | -9.62 | -7.14 | -1.92 | - | +1.14 | +3.21 | +10.21 |
| Level | Major | Minor | Major | - | Intermediate | Major | Minor |
Pivot points can also be used to set your price objectives. Here is the price situation in relation to pivot points:
| Pivot points | S3 | S2 | S1 | PP | R1 | R2 | R3 |
|---|---|---|---|---|---|---|---|
| Standard | 45.21 | 45.83 | 46.24 | 46.86 | 47.27 | 47.89 | 48.30 |
| Camarilla | 46.36 | 46.45 | 46.55 | 46.64 | 46.73 | 46.83 | 46.92 |
| Woodie | 45.10 | 45.78 | 46.13 | 46.81 | 47.16 | 47.84 | 48.19 |
| Fibonacci | 45.83 | 46.23 | 46.47 | 46.86 | 47.26 | 47.50 | 47.89 |
| Pivot points | S3 | S2 | S1 | PP | R1 | R2 | R3 |
|---|---|---|---|---|---|---|---|
| Standard | 38.06 | 40.18 | 43.65 | 45.77 | 49.24 | 51.36 | 54.83 |
| Camarilla | 45.59 | 46.11 | 46.62 | 47.13 | 47.64 | 48.16 | 48.67 |
| Woodie | 38.75 | 40.52 | 44.34 | 46.11 | 49.93 | 51.70 | 55.52 |
| Fibonacci | 40.18 | 42.31 | 43.63 | 45.77 | 47.90 | 49.22 | 51.36 |
| Pivot points | S3 | S2 | S1 | PP | R1 | R2 | R3 |
|---|---|---|---|---|---|---|---|
| Standard | 35.50 | 38.14 | 40.11 | 42.75 | 44.72 | 47.36 | 49.33 |
| Camarilla | 40.81 | 41.24 | 41.66 | 42.08 | 42.50 | 42.93 | 43.35 |
| Woodie | 35.17 | 37.97 | 39.78 | 42.58 | 44.39 | 47.19 | 49.00 |
| Fibonacci | 38.14 | 39.90 | 40.99 | 42.75 | 44.51 | 45.60 | 47.36 |
Numerical data
The following are the details of the technical indicators and moving averages that were collected to generate this technical analysis:
| RSI (14): | 53.57 | |
| MACD (12,26,9): | 1.0000 | |
| Directional Movement: | 5.51 | |
| AROON (14): | 42.85 | |
| DEMA (21): | 46.14 | |
| Parabolic SAR (0,02-0,02-0,2): | 47.95 | |
| Elder Ray (13): | 0.58 | |
| Super Trend (3,10): | 43.84 | |
| Zig ZAG (10): | 45.23 | |
| VORTEX (21): | 1.1000 | |
| Stochastique (14,3,5): | 76.15 | |
| TEMA (21): | 46.96 | |
| Williams %R (14): | -48.59 | |
| Chande Momentum Oscillator (20): | 2.41 | |
| Repulse (5,40,3): | -4.7900 | |
| ROCnROLL: | -1 | |
| TRIX (15,9): | 0.2300 | |
| Courbe Coppock: | 19.80 |
| MA7: | 46.78 | |
| MA20: | 44.34 | |
| MA50: | 43.94 | |
| MA100: | 42.70 | |
| MAexp7: | 46.18 | |
| MAexp20: | 45.03 | |
| MAexp50: | 43.99 | |
| MAexp100: | 42.80 | |
| Price / MA7: | -3.51% | |
| Price / MA20: | +1.80% | |
| Price / MA50: | +2.73% | |
| Price / MA100: | +5.71% | |
| Price / MAexp7: | -2.25% | |
| Price / MAexp20: | +0.24% | |
| Price / MAexp50: | +2.61% | |
| Price / MAexp100: | +5.47% |
News
The last news published on BECHTLE AG O.N. at the time of the generation of this analysis was as follows:
- EQS-News: Bechtle Continues to Record Profitable Growth in Third Quarter
- EQS-News: Bechtle Confirms Forecast after Successful Q2
- EQS-News: Bechtle AG: Bechtle Reports Higher Dividend and Expanded Supervisory Board
- EQS-News: Bechtle Reports Strong First Quarter
- EQS-News: Bechtle continues to grow much faster than the market in 2022
About author
Online


Add a comment
Comments
0 comments on the analysis BECHTLE AG O.N. - Daily