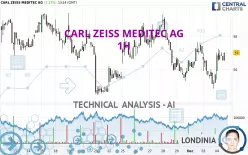
CARL ZEISS MEDITEC AG - 1H - Technical analysis published on 12/04/2024 (GMT)
- 122
- 0
Click here for a new analysis!
- Timeframe : 1H
- - Analysis generated on
- Status : TARGET REACHED

Summary of the analysis

Additional analysis
Quotes
The CARL ZEISS MEDITEC AG rating is 57.00 EUR. The price has increased by +2.33% since the last closing and was traded between 55.40 EUR and 57.25 EUR over the period. The price is currently at +2.89% from its lowest and -0.44% from its highest.A bullish opening was detected by the Central Gaps scanner. Buyers are trying to impose a bullish momentum in the very short term.
Bullish opening
Type : Bullish
Timeframe : Openning
Here is a more detailed summary of the historical variations registered by CARL ZEISS MEDITEC AG:
Near a new LOW record (5 years)
Type : Bearish
Timeframe : Weekly
Near a new LOW record (1 year)
Type : Bearish
Timeframe : Weekly
Near a new LOW record (1st january)
Type : Bearish
Timeframe : Weekly
Near a new LOW record (1 month)
Type : Bearish
Timeframe : Weekly
Technical
Technical analysis of this 1H chart of CARL ZEISS MEDITEC AG indicates that the overall trend is slightly bullish. 57.14% of the signals given by moving averages are bullish. This slightly bullish trend could be reinforced by the strong bullish signals given by short-term moving averages. The Central Indicators scanner detects bullish and bearish signals on moving averages that could impact this trend:
Bearish price crossover with Moving Average 50
Type : Bearish
Timeframe : 1 hour
Bearish price crossover with Moving Average 100
Type : Bearish
Timeframe : 1 hour
Bearish price crossover with adaptative moving average 20
Type : Bearish
Timeframe : 1 hour
Bullish price crossover with adaptative moving average 50
Type : Bullish
Timeframe : 1 hour
In fact, 14 technical indicators on 18 studied are currently bullish. The Central Indicators scanner found this result concerning these indicators:
Aroon indicator bullish trend
Type : Bullish
Timeframe : 1 hour
The Central Patterns scanner, which studies chart patterns, resistances and supports, has identified these signals:
Near horizontal resistance
Type : Bearish
Timeframe : 1 hour
Near resistance of channel
Type : Bearish
Timeframe : 1 hour
There is also a Japanese candlestick pattern detected by Central Candlesticks that could mark the end of the current short-term trend:
Doji
Type : Neutral
Timeframe : 1 hour
| S3 | S2 | S1 | Price | R1 | R2 | R3 | |
|---|---|---|---|---|---|---|---|
| ProTrendLines | 54.45 | 55.75 | 56.60 | 57.00 | 57.64 | 59.40 | 60.75 |
| Change (%) | -4.47% | -2.19% | -0.70% | - | +1.12% | +4.21% | +6.58% |
| Change | -2.55 | -1.25 | -0.40 | - | +0.64 | +2.40 | +3.75 |
| Level | Minor | Major | Intermediate | - | Minor | Intermediate | Major |
Pivot points can also be used to set your price objectives. Here is the price situation in relation to pivot points:
| Pivot points | S3 | S2 | S1 | PP | R1 | R2 | R3 |
|---|---|---|---|---|---|---|---|
| Standard | 52.55 | 53.70 | 54.70 | 55.85 | 56.85 | 58.00 | 59.00 |
| Camarilla | 55.11 | 55.31 | 55.50 | 55.70 | 55.90 | 56.09 | 56.29 |
| Woodie | 52.48 | 53.66 | 54.63 | 55.81 | 56.78 | 57.96 | 58.93 |
| Fibonacci | 53.70 | 54.52 | 55.03 | 55.85 | 56.67 | 57.18 | 58.00 |
| Pivot points | S3 | S2 | S1 | PP | R1 | R2 | R3 |
|---|---|---|---|---|---|---|---|
| Standard | 50.80 | 53.05 | 54.80 | 57.05 | 58.80 | 61.05 | 62.80 |
| Camarilla | 55.45 | 55.82 | 56.18 | 56.55 | 56.92 | 57.28 | 57.65 |
| Woodie | 50.55 | 52.93 | 54.55 | 56.93 | 58.55 | 60.93 | 62.55 |
| Fibonacci | 53.05 | 54.58 | 55.52 | 57.05 | 58.58 | 59.52 | 61.05 |
| Pivot points | S3 | S2 | S1 | PP | R1 | R2 | R3 |
|---|---|---|---|---|---|---|---|
| Standard | 46.78 | 50.62 | 53.58 | 57.42 | 60.38 | 64.22 | 67.18 |
| Camarilla | 54.68 | 55.30 | 55.93 | 56.55 | 57.17 | 57.80 | 58.42 |
| Woodie | 46.35 | 50.40 | 53.15 | 57.20 | 59.95 | 64.00 | 66.75 |
| Fibonacci | 50.62 | 53.21 | 54.82 | 57.42 | 60.01 | 61.62 | 64.22 |
Numerical data
The following are the details of the technical indicators and moving averages that were collected to generate this technical analysis:
| RSI (14): | 55.49 | |
| MACD (12,26,9): | -0.0600 | |
| Directional Movement: | 8.49 | |
| AROON (14): | -64.29 | |
| DEMA (21): | 56.22 | |
| Parabolic SAR (0,02-0,02-0,2): | 55.08 | |
| Elder Ray (13): | 0.60 | |
| Super Trend (3,10): | 55.18 | |
| Zig ZAG (10): | 56.85 | |
| VORTEX (21): | 1.0400 | |
| Stochastique (14,3,5): | 73.31 | |
| TEMA (21): | 56.32 | |
| Williams %R (14): | -21.57 | |
| Chande Momentum Oscillator (20): | 0.25 | |
| Repulse (5,40,3): | 0.4200 | |
| ROCnROLL: | 1 | |
| TRIX (15,9): | -0.0500 | |
| Courbe Coppock: | 2.00 |
| MA7: | 56.94 | |
| MA20: | 57.41 | |
| MA50: | 61.13 | |
| MA100: | 61.33 | |
| MAexp7: | 56.46 | |
| MAexp20: | 56.36 | |
| MAexp50: | 56.60 | |
| MAexp100: | 56.95 | |
| Price / MA7: | +0.11% | |
| Price / MA20: | -0.71% | |
| Price / MA50: | -6.76% | |
| Price / MA100: | -7.06% | |
| Price / MAexp7: | +0.96% | |
| Price / MAexp20: | +1.14% | |
| Price / MAexp50: | +0.71% | |
| Price / MAexp100: | +0.09% |
News
Don't forget to follow the news on CARL ZEISS MEDITEC AG. At the time of publication of this analysis, the latest news was as follows:
- ZEISS introduces its latest Robotic Visualisation System for neuro surgery
- EQS-News: Carl Zeiss Meditec closes first nine months of 2023/24 with slight decline in revenue
- EQS-Adhoc: Carl Zeiss Meditec AG: Revenue and EBIT forecast for fiscal year 2023/24 reduced amid slower than expected recovery of equipment business
- EQS-News: Carl Zeiss Meditec closes first six months 2023/24 with a slight decline in revenue due to currency effects
- Carl Zeiss Meditec AG Completes Acquisition of Dutch Ophthalmic Research Center (D.O.R.C.); Companies Unite to Shape Ophthalmology Market
About author
Online


Add a comment
Comments
0 comments on the analysis CARL ZEISS MEDITEC AG - 1H