| Open: | - |
| Change: | - |
| Volume: | - |
| Low: | - |
| High: | - |
| High / Low range: | - |
| Type: | Stocks |
| Ticker: | AFX |
| ISIN: | DE0005313704 |
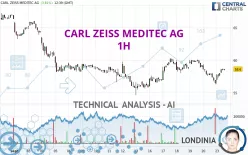
CARL ZEISS MEDITEC AG - 1H - Technical analysis published on 09/23/2024 (GMT)
- 105
- 0
- 09/23/2024 - 12:55
Click here for a new analysis!
- Timeframe : 1H
- - Analysis generated on 09/23/2024 - 12:55
- Status : TARGET REACHED

Summary of the analysis

Additional analysis
Quotes
CARL ZEISS MEDITEC AG rating 58.60 EUR. The price registered an increase of +3.81% on the session with the lowest point at 56.35 EUR and the highest point at 58.65 EUR. The deviation from the price is +3.99% for the low point and -0.09% for the high point.The Central Gaps scanner detects a bullish opening. A small advantage for buyers in the very short term.
Bullish opening
Type : Bullish
Timeframe : Openning
So that you have an overall view of the price change, here is a table showing the variations over several periods:
Near a new LOW record (5 years)
Type : Bearish
Timeframe : Weekly
Near a new LOW record (1 year)
Type : Bearish
Timeframe : Weekly
Near a new LOW record (1st january)
Type : Bearish
Timeframe : Weekly
Near a new LOW record (1 month)
Type : Bearish
Timeframe : Weekly
Technical
A technical analysis in 1H of this CARL ZEISS MEDITEC AG chart shows a slightly bullish trend. 60.71% of the signals given by moving averages are bullish. The slightly bullish signals given by short-term moving averages do not show a strengthening of this global trend. The Central Indicators scanner does not detect any result on moving averages that would impact this trend.
In fact, 11 technical indicators on 18 studied are currently positioned bullish. Caution: the Central Indicators scanner currently detects an excess:
Williams %R indicator is overbought : over -20
Type : Neutral
Timeframe : 1 hour
Pivot points : price is over resistance 1
Type : Neutral
Timeframe : 1 hour
Ichimoku : price is over the cloud
Type : Bullish
Timeframe : 1 hour
Price is back over the pivot point
Type : Bullish
Timeframe : Weekly
Central Patterns, the market scanner focusing on chart patterns, resistances and supports found these results:
Near horizontal resistance
Type : Bearish
Timeframe : 1 hour
Near resistance of channel
Type : Bearish
Timeframe : 1 hour
The Central Candlesticks scanner which studies Japanese candlesticks did not detect anything.
| S3 | S2 | S1 | Price | R1 | R2 | R3 | |
|---|---|---|---|---|---|---|---|
| ProTrendLines | 54.60 | 55.65 | 58.52 | 58.60 | 60.09 | 63.90 | 67.28 |
| Change (%) | -6.83% | -5.03% | -0.14% | - | +2.54% | +9.04% | +14.81% |
| Change | -4.00 | -2.95 | -0.08 | - | +1.49 | +5.30 | +8.68 |
| Level | Major | Minor | Major | - | Minor | Minor | Minor |
Attention could also be paid to pivot points to set price objectives:
| Pivot points | S3 | S2 | S1 | PP | R1 | R2 | R3 |
|---|---|---|---|---|---|---|---|
| Standard | 52.25 | 54.25 | 55.35 | 57.35 | 58.45 | 60.45 | 61.55 |
| Camarilla | 55.60 | 55.88 | 56.17 | 56.45 | 56.73 | 57.02 | 57.30 |
| Woodie | 51.80 | 54.03 | 54.90 | 57.13 | 58.00 | 60.23 | 61.10 |
| Fibonacci | 54.25 | 55.43 | 56.17 | 57.35 | 58.53 | 59.27 | 60.45 |
| Pivot points | S3 | S2 | S1 | PP | R1 | R2 | R3 |
|---|---|---|---|---|---|---|---|
| Standard | 50.47 | 53.18 | 54.82 | 57.53 | 59.17 | 61.88 | 63.52 |
| Camarilla | 55.25 | 55.65 | 56.05 | 56.45 | 56.85 | 57.25 | 57.65 |
| Woodie | 49.93 | 52.91 | 54.28 | 57.26 | 58.63 | 61.61 | 62.98 |
| Fibonacci | 53.18 | 54.85 | 55.87 | 57.53 | 59.20 | 60.22 | 61.88 |
| Pivot points | S3 | S2 | S1 | PP | R1 | R2 | R3 |
|---|---|---|---|---|---|---|---|
| Standard | 52.85 | 55.95 | 61.15 | 64.25 | 69.45 | 72.55 | 77.75 |
| Camarilla | 64.07 | 64.83 | 65.59 | 66.35 | 67.11 | 67.87 | 68.63 |
| Woodie | 53.90 | 56.48 | 62.20 | 64.78 | 70.50 | 73.08 | 78.80 |
| Fibonacci | 55.95 | 59.12 | 61.08 | 64.25 | 67.42 | 69.38 | 72.55 |
Numerical data
The following is the status of the technical indicators and moving averages at the time of publication of this technical analysis:
| RSI (14): | 53.95 | |
| MACD (12,26,9): | -0.1500 | |
| Directional Movement: | -1.26 | |
| AROON (14): | -57.14 | |
| DEMA (21): | 58.02 | |
| Parabolic SAR (0,02-0,02-0,2): | 56.39 | |
| Elder Ray (13): | 0.39 | |
| Super Trend (3,10): | 56.89 | |
| Zig ZAG (10): | 58.65 | |
| VORTEX (21): | 0.8600 | |
| Stochastique (14,3,5): | 82.26 | |
| TEMA (21): | 57.85 | |
| Williams %R (14): | 0.00 | |
| Chande Momentum Oscillator (20): | 0.75 | |
| Repulse (5,40,3): | 1.1900 | |
| ROCnROLL: | 1 | |
| TRIX (15,9): | -0.0600 | |
| Courbe Coppock: | 3.19 |
| MA7: | 57.93 | |
| MA20: | 60.30 | |
| MA50: | 61.53 | |
| MA100: | 70.75 | |
| MAexp7: | 58.19 | |
| MAexp20: | 58.23 | |
| MAexp50: | 58.36 | |
| MAexp100: | 58.83 | |
| Price / MA7: | +1.16% | |
| Price / MA20: | -2.82% | |
| Price / MA50: | -4.76% | |
| Price / MA100: | -17.17% | |
| Price / MAexp7: | +0.70% | |
| Price / MAexp20: | +0.64% | |
| Price / MAexp50: | +0.41% | |
| Price / MAexp100: | -0.39% |
News
The latest news and videos published on CARL ZEISS MEDITEC AG at the time of the analysis were as follows:
- 08/06/2024 - 05:00 EQS-News: Carl Zeiss Meditec closes first nine months of 2023/24 with slight decline in revenue
- 06/17/2024 - 08:09 EQS-Adhoc: Carl Zeiss Meditec AG: Revenue and EBIT forecast for fiscal year 2023/24 reduced amid slower than expected recovery of equipment business
- 05/08/2024 - 04:26 EQS-News: Carl Zeiss Meditec closes first six months 2023/24 with a slight decline in revenue due to currency effects
- 04/04/2024 - 11:00 Carl Zeiss Meditec AG Completes Acquisition of Dutch Ophthalmic Research Center (D.O.R.C.); Companies Unite to Shape Ophthalmology Market
- 04/04/2024 - 11:00 Carl Zeiss Meditec AG Completes Acquisition of Dutch Ophthalmic Research Center (D.O.R.C.); Companies Unite to Shape Ophthalmology Market
About author
Online


Add a comment
Comments
0 comments on the analysis CARL ZEISS MEDITEC AG - 1H