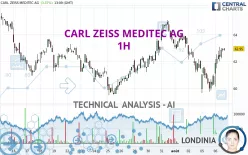
CARL ZEISS MEDITEC AG - 1H - Technical analysis published on 08/06/2024 (GMT)
- 204
- 0
Click here for a new analysis!
- Timeframe : 1H
- - Analysis generated on
- Status : INVALID

Summary of the analysis

Additional analysis
Quotes
CARL ZEISS MEDITEC AG rating 62.95 EUR. The price registered an increase of +3.37% on the session with the lowest point at 60.15 EUR and the highest point at 63.10 EUR. The deviation from the price is +4.66% for the low point and -0.24% for the high point.A bullish opening was detected by the Central Gaps scanner. Buyers are trying to impose a bullish momentum in the very short term.
Bullish opening
Type : Bullish
Timeframe : Openning
So that you have an overall view of the price change, here is a table showing the variations over several periods:
Near a new LOW record (5 years)
Type : Bearish
Timeframe : Weekly
Near a new LOW record (1 year)
Type : Bearish
Timeframe : Weekly
Near a new LOW record (1st january)
Type : Bearish
Timeframe : Weekly
Near a new LOW record (1 month)
Type : Bearish
Timeframe : Weekly
Technical
Technical analysis of CARL ZEISS MEDITEC AG in 1H shows an overall bullish trend. The signals returned by the moving averages are 64.29% bullish. This bullish trend is reinforced by the strong signals currently being given by short-term moving averages. The Central Indicators scanner does not detect any result on moving averages that would impact this trend.
In fact, according to the parameters integrated into the Central Analyzer system, 15 technical indicators out of 18 analysed are currently bullish. Caution: the Central Indicators scanner currently detects an excess:
CCI indicator is overbought : over 100
Type : Neutral
Timeframe : 1 hour
Williams %R indicator is overbought : over -20
Type : Neutral
Timeframe : 1 hour
Pivot points : price is over resistance 2
Type : Neutral
Timeframe : 1 hour
MACD indicator is back over 0
Type : Bullish
Timeframe : 1 hour
Price is back over the pivot point
Type : Bullish
Timeframe : Weekly
The analysis of the price chart with Central Patterns scanners does not return any result.
The Central Candlesticks scanner, specialised in Japanese candlesticks, did not identify any signals.
| S3 | S2 | S1 | Price | R1 | R2 | R3 | |
|---|---|---|---|---|---|---|---|
| ProTrendLines | 60.50 | 61.24 | 62.15 | 62.95 | 63.30 | 65.58 | 73.34 |
| Change (%) | -3.89% | -2.72% | -1.27% | - | +0.56% | +4.18% | +16.51% |
| Change | -2.45 | -1.71 | -0.80 | - | +0.35 | +2.63 | +10.39 |
| Level | Minor | Minor | Minor | - | Intermediate | Intermediate | Intermediate |
To determine price objectives, it is also possible to use the pivot points. Here is the price position in relation to pivot points:
| Pivot points | S3 | S2 | S1 | PP | R1 | R2 | R3 |
|---|---|---|---|---|---|---|---|
| Standard | 57.88 | 58.77 | 59.83 | 60.72 | 61.78 | 62.67 | 63.73 |
| Camarilla | 60.36 | 60.54 | 60.72 | 60.90 | 61.08 | 61.26 | 61.44 |
| Woodie | 57.98 | 58.81 | 59.93 | 60.76 | 61.88 | 62.71 | 63.83 |
| Fibonacci | 58.77 | 59.51 | 59.97 | 60.72 | 61.46 | 61.92 | 62.67 |
| Pivot points | S3 | S2 | S1 | PP | R1 | R2 | R3 |
|---|---|---|---|---|---|---|---|
| Standard | 56.40 | 58.75 | 60.40 | 62.75 | 64.40 | 66.75 | 68.40 |
| Camarilla | 60.95 | 61.32 | 61.68 | 62.05 | 62.42 | 62.78 | 63.15 |
| Woodie | 56.05 | 58.58 | 60.05 | 62.58 | 64.05 | 66.58 | 68.05 |
| Fibonacci | 58.75 | 60.28 | 61.22 | 62.75 | 64.28 | 65.22 | 66.75 |
| Pivot points | S3 | S2 | S1 | PP | R1 | R2 | R3 |
|---|---|---|---|---|---|---|---|
| Standard | 52.40 | 55.95 | 59.65 | 63.20 | 66.90 | 70.45 | 74.15 |
| Camarilla | 61.36 | 62.02 | 62.69 | 63.35 | 64.02 | 64.68 | 65.34 |
| Woodie | 52.48 | 55.99 | 59.73 | 63.24 | 66.98 | 70.49 | 74.23 |
| Fibonacci | 55.95 | 58.72 | 60.43 | 63.20 | 65.97 | 67.68 | 70.45 |
Numerical data
The following are the details of the technical indicators and moving averages that were collected to generate this technical analysis:
| RSI (14): | 59.29 | |
| MACD (12,26,9): | 0.0700 | |
| Directional Movement: | 3.97 | |
| AROON (14): | 50.00 | |
| DEMA (21): | 61.96 | |
| Parabolic SAR (0,02-0,02-0,2): | 61.24 | |
| Elder Ray (13): | 0.77 | |
| Super Trend (3,10): | 60.60 | |
| Zig ZAG (10): | 62.90 | |
| VORTEX (21): | 1.0200 | |
| Stochastique (14,3,5): | 93.11 | |
| TEMA (21): | 62.23 | |
| Williams %R (14): | -4.48 | |
| Chande Momentum Oscillator (20): | 2.20 | |
| Repulse (5,40,3): | 0.8600 | |
| ROCnROLL: | 1 | |
| TRIX (15,9): | -0.0700 | |
| Courbe Coppock: | 3.24 |
| MA7: | 62.54 | |
| MA20: | 62.67 | |
| MA50: | 69.69 | |
| MA100: | 86.31 | |
| MAexp7: | 62.44 | |
| MAexp20: | 62.01 | |
| MAexp50: | 62.15 | |
| MAexp100: | 62.32 | |
| Price / MA7: | +0.66% | |
| Price / MA20: | +0.45% | |
| Price / MA50: | -9.67% | |
| Price / MA100: | -27.07% | |
| Price / MAexp7: | +0.82% | |
| Price / MAexp20: | +1.52% | |
| Price / MAexp50: | +1.29% | |
| Price / MAexp100: | +1.01% |
News
The latest news and videos published on CARL ZEISS MEDITEC AG at the time of the analysis were as follows:
- EQS-News: Carl Zeiss Meditec closes first nine months of 2023/24 with slight decline in revenue
- EQS-Adhoc: Carl Zeiss Meditec AG: Revenue and EBIT forecast for fiscal year 2023/24 reduced amid slower than expected recovery of equipment business
- EQS-News: Carl Zeiss Meditec closes first six months 2023/24 with a slight decline in revenue due to currency effects
- Carl Zeiss Meditec AG Completes Acquisition of Dutch Ophthalmic Research Center (D.O.R.C.); Companies Unite to Shape Ophthalmology Market
- Carl Zeiss Meditec AG Completes Acquisition of Dutch Ophthalmic Research Center (D.O.R.C.); Companies Unite to Shape Ophthalmology Market
About author
Online


Add a comment
Comments
0 comments on the analysis CARL ZEISS MEDITEC AG - 1H