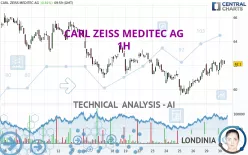
CARL ZEISS MEDITEC AG - 1H - Technical analysis published on 07/30/2024 (GMT)
- 188
- 0
Click here for a new analysis!
- Timeframe : 1H
- - Analysis generated on
- Status : TARGET REACHED

Summary of the analysis

Additional analysis
Quotes
The CARL ZEISS MEDITEC AG rating is 62.35 EUR. The price has increased by +1.22% since the last closing with the lowest point at 61.60 EUR and the highest point at 62.50 EUR. The deviation from the price is +1.22% for the low point and -0.24% for the high point.So that you have an overall view of the price change, here is a table showing the variations over several periods:
Near a new LOW record (5 years)
Type : Bearish
Timeframe : Weekly
Near a new LOW record (1 year)
Type : Bearish
Timeframe : Weekly
Near a new LOW record (1st january)
Type : Bearish
Timeframe : Weekly
Near a new LOW record (1 month)
Type : Bearish
Timeframe : Weekly
Technical
Technical analysis of this 1H chart of CARL ZEISS MEDITEC AG indicates that the overall trend is slightly bullish. Only 60.71% of the signals given by moving averages are bullish. This slightly bullish trend is reinforced by the strong signals currently being given by short-term moving averages. There is no crossing of moving average by the price or crossing of moving averages between themselves.
An assessment of technical indicators shows a strong bullish signal.
But beware of excesses. The Central Indicators scanner currently detects this:
CCI indicator is overbought : over 100
Type : Neutral
Timeframe : 1 hour
Williams %R indicator is overbought : over -20
Type : Neutral
Timeframe : 1 hour
Pivot points : price is over resistance 1
Type : Neutral
Timeframe : 1 hour
The Central Patterns scanner, which studies chart patterns, resistances and supports, has identified these signals:
Near horizontal resistance
Type : Bearish
Timeframe : 1 hour
Near resistance of channel
Type : Bearish
Timeframe : 1 hour
The Central Candlesticks scanner which studies Japanese candlesticks did not detect anything.
| S3 | S2 | S1 | Price | R1 | R2 | R3 | |
|---|---|---|---|---|---|---|---|
| ProTrendLines | 60.95 | 61.55 | 62.15 | 62.35 | 63.30 | 64.49 | 65.04 |
| Change (%) | -2.25% | -1.28% | -0.32% | - | +1.52% | +3.43% | +4.31% |
| Change | -1.40 | -0.80 | -0.20 | - | +0.95 | +2.14 | +2.69 |
| Level | Intermediate | Minor | Minor | - | Minor | Minor | Intermediate |
To determine price objectives, it is also possible to use the pivot points. Here is the price position in relation to pivot points:
| Pivot points | S3 | S2 | S1 | PP | R1 | R2 | R3 |
|---|---|---|---|---|---|---|---|
| Standard | 59.70 | 60.40 | 61.00 | 61.70 | 62.30 | 63.00 | 63.60 |
| Camarilla | 61.24 | 61.36 | 61.48 | 61.60 | 61.72 | 61.84 | 61.96 |
| Woodie | 59.65 | 60.38 | 60.95 | 61.68 | 62.25 | 62.98 | 63.55 |
| Fibonacci | 60.40 | 60.90 | 61.20 | 61.70 | 62.20 | 62.50 | 63.00 |
| Pivot points | S3 | S2 | S1 | PP | R1 | R2 | R3 |
|---|---|---|---|---|---|---|---|
| Standard | 55.90 | 57.70 | 59.70 | 61.50 | 63.50 | 65.30 | 67.30 |
| Camarilla | 60.66 | 61.00 | 61.35 | 61.70 | 62.05 | 62.40 | 62.75 |
| Woodie | 56.00 | 57.75 | 59.80 | 61.55 | 63.60 | 65.35 | 67.40 |
| Fibonacci | 57.70 | 59.15 | 60.05 | 61.50 | 62.95 | 63.85 | 65.30 |
| Pivot points | S3 | S2 | S1 | PP | R1 | R2 | R3 |
|---|---|---|---|---|---|---|---|
| Standard | 31.60 | 46.95 | 56.30 | 71.65 | 81.00 | 96.35 | 105.70 |
| Camarilla | 58.86 | 61.12 | 63.39 | 65.65 | 67.91 | 70.18 | 72.44 |
| Woodie | 28.60 | 45.45 | 53.30 | 70.15 | 78.00 | 94.85 | 102.70 |
| Fibonacci | 46.95 | 56.39 | 62.22 | 71.65 | 81.09 | 86.92 | 96.35 |
Numerical data
The following is the status of the technical indicators and moving averages at the time of publication of this technical analysis:
| RSI (14): | 61.51 | |
| MACD (12,26,9): | 0.3200 | |
| Directional Movement: | 16.72 | |
| AROON (14): | 92.86 | |
| DEMA (21): | 62.02 | |
| Parabolic SAR (0,02-0,02-0,2): | 61.23 | |
| Elder Ray (13): | 0.35 | |
| Super Trend (3,10): | 60.88 | |
| Zig ZAG (10): | 62.30 | |
| VORTEX (21): | 1.1800 | |
| Stochastique (14,3,5): | 89.18 | |
| TEMA (21): | 62.37 | |
| Williams %R (14): | -14.29 | |
| Chande Momentum Oscillator (20): | 0.60 | |
| Repulse (5,40,3): | 1.2300 | |
| ROCnROLL: | 1 | |
| TRIX (15,9): | 0.0600 | |
| Courbe Coppock: | 3.39 |
| MA7: | 61.58 | |
| MA20: | 63.22 | |
| MA50: | 72.64 | |
| MA100: | 89.15 | |
| MAexp7: | 62.08 | |
| MAexp20: | 61.65 | |
| MAexp50: | 61.56 | |
| MAexp100: | 62.14 | |
| Price / MA7: | +1.25% | |
| Price / MA20: | -1.38% | |
| Price / MA50: | -14.17% | |
| Price / MA100: | -30.06% | |
| Price / MAexp7: | +0.43% | |
| Price / MAexp20: | +1.14% | |
| Price / MAexp50: | +1.28% | |
| Price / MAexp100: | +0.34% |
News
Don't forget to follow the news on CARL ZEISS MEDITEC AG. At the time of publication of this analysis, the latest news was as follows:
- EQS-Adhoc: Carl Zeiss Meditec AG: Revenue and EBIT forecast for fiscal year 2023/24 reduced amid slower than expected recovery of equipment business
- EQS-News: Carl Zeiss Meditec closes first six months 2023/24 with a slight decline in revenue due to currency effects
- Carl Zeiss Meditec AG Completes Acquisition of Dutch Ophthalmic Research Center (D.O.R.C.); Companies Unite to Shape Ophthalmology Market
- Carl Zeiss Meditec AG Completes Acquisition of Dutch Ophthalmic Research Center (D.O.R.C.); Companies Unite to Shape Ophthalmology Market
- EQS-News: Carl Zeiss Meditec achieves slight revenue growth in first quarter of 2023/24
About author
Online


Add a comment
Comments
0 comments on the analysis CARL ZEISS MEDITEC AG - 1H