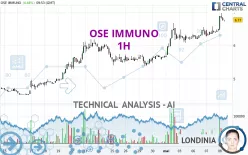
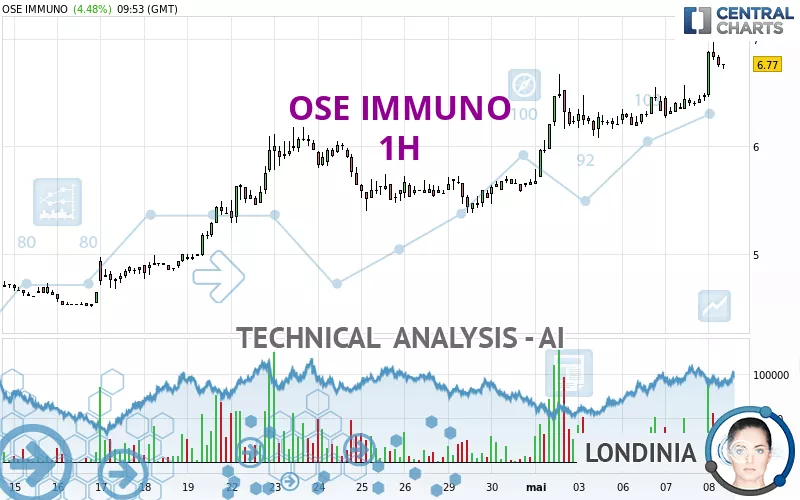
OSE IMMUNO - 1H - Technical analysis published on 05/08/2024 (GMT)
- 157
- 0
Click here for a new analysis!
- Timeframe : 1H
- - Analysis generated on
- Status : LEVEL MAINTAINED
Summary of the analysis

Additional analysis
Quotes
OSE IMMUNO rating 6.80 EUR. The price registered an increase of +4.94% on the session and was between 6.46 EUR and 6.97 EUR. This implies that the price is at +5.26% from its lowest and at -2.44% from its highest.A study of price movements over other periods shows the following variations:
Near a new HIGH record (1 year)
Type : Bullish
Timeframe : Weekly
New HIGH record (1st january)
Type : Bullish
Timeframe : Weekly
New HIGH record (1 month)
Type : Bullish
Timeframe : Weekly
Technical
Technical analysis of OSE IMMUNO in 1H shows a strongly overall bullish trend. 92.86% of the signals given by moving averages are bullish. The overall trend is supported by the strong bullish signals from short-term moving averages. The Central Indicators market scanner currently does not detect any result that concerns moving averages.
Technical indicators are strongly bullish, suggesting that the price increase should continue.
But beware of excesses. The Central Indicators scanner currently detects this:
RSI indicator is overbought : over 70
Type : Neutral
Timeframe : 1 hour
CCI indicator is overbought : over 100
Type : Neutral
Timeframe : 1 hour
Previous candle closed over Bollinger bands
Type : Neutral
Timeframe : 1 hour
Pivot points : price is over resistance 1
Type : Neutral
Timeframe : Weekly
Pivot points : price is over resistance 2
Type : Neutral
Timeframe : 1 hour
The Central Patterns scanner, which studies chart patterns, resistances and supports, has identified this signal:
Resistance of channel is broken
Type : Bullish
Timeframe : 1 hour
No result was found by the Central Candlesticks scanner on Japanese candlesticks.
| S3 | S2 | S1 | Price | R1 | R2 | R3 | |
|---|---|---|---|---|---|---|---|
| ProTrendLines | 5.32 | 6.24 | 6.67 | 6.80 | 9.50 | 11.60 | 13.16 |
| Change (%) | -21.76% | -8.24% | -1.91% | - | +39.71% | +70.59% | +93.53% |
| Change | -1.48 | -0.56 | -0.13 | - | +2.70 | +4.80 | +6.36 |
| Level | Intermediate | Major | Intermediate | - | Minor | Minor | Intermediate |
To determine price objectives, it is also possible to use the pivot points. Here is the price position in relation to pivot points:
| Pivot points | S3 | S2 | S1 | PP | R1 | R2 | R3 |
|---|---|---|---|---|---|---|---|
| Standard | 5.99 | 6.13 | 6.30 | 6.44 | 6.61 | 6.75 | 6.92 |
| Camarilla | 6.40 | 6.42 | 6.45 | 6.48 | 6.51 | 6.54 | 6.57 |
| Woodie | 6.02 | 6.14 | 6.33 | 6.45 | 6.64 | 6.76 | 6.95 |
| Fibonacci | 6.13 | 6.25 | 6.32 | 6.44 | 6.56 | 6.63 | 6.75 |
| Pivot points | S3 | S2 | S1 | PP | R1 | R2 | R3 |
|---|---|---|---|---|---|---|---|
| Standard | 4.21 | 4.79 | 5.50 | 6.08 | 6.79 | 7.37 | 8.08 |
| Camarilla | 5.85 | 5.96 | 6.08 | 6.20 | 6.32 | 6.44 | 6.56 |
| Woodie | 4.27 | 4.82 | 5.56 | 6.11 | 6.85 | 7.40 | 8.14 |
| Fibonacci | 4.79 | 5.29 | 5.59 | 6.08 | 6.58 | 6.88 | 7.37 |
| Pivot points | S3 | S2 | S1 | PP | R1 | R2 | R3 |
|---|---|---|---|---|---|---|---|
| Standard | 3.04 | 3.77 | 4.71 | 5.44 | 6.38 | 7.11 | 8.05 |
| Camarilla | 5.18 | 5.33 | 5.49 | 5.64 | 5.79 | 5.95 | 6.10 |
| Woodie | 3.14 | 3.82 | 4.81 | 5.49 | 6.48 | 7.16 | 8.15 |
| Fibonacci | 3.77 | 4.41 | 4.81 | 5.44 | 6.08 | 6.48 | 7.11 |
Numerical data
The following is the status of the technical indicators and moving averages at the time of publication of this technical analysis:
| RSI (14): | 69.77 | |
| MACD (12,26,9): | 0.1500 | |
| Directional Movement: | 32.60 | |
| AROON (14): | 71.43 | |
| DEMA (21): | 6.66 | |
| Parabolic SAR (0,02-0,02-0,2): | 6.40 | |
| Elder Ray (13): | 0.25 | |
| Super Trend (3,10): | 6.46 | |
| Zig ZAG (10): | 6.80 | |
| VORTEX (21): | 1.1900 | |
| Stochastique (14,3,5): | 84.92 | |
| TEMA (21): | 6.70 | |
| Williams %R (14): | -23.94 | |
| Chande Momentum Oscillator (20): | 0.47 | |
| Repulse (5,40,3): | 2.4600 | |
| ROCnROLL: | 1 | |
| TRIX (15,9): | 0.2600 | |
| Courbe Coppock: | 10.02 |
| MA7: | 6.18 | |
| MA20: | 5.53 | |
| MA50: | 5.09 | |
| MA100: | 4.49 | |
| MAexp7: | 6.66 | |
| MAexp20: | 6.47 | |
| MAexp50: | 6.22 | |
| MAexp100: | 5.93 | |
| Price / MA7: | +10.03% | |
| Price / MA20: | +22.97% | |
| Price / MA50: | +33.60% | |
| Price / MA100: | +51.45% | |
| Price / MAexp7: | +2.10% | |
| Price / MAexp20: | +5.10% | |
| Price / MAexp50: | +9.32% | |
| Price / MAexp100: | +14.67% |
News
The last news published on OSE IMMUNO at the time of the generation of this analysis was as follows:
- OSE Immunotherapeutics Receives €8.4 M in Public Funding to Support the Registration Phase 3 Clinical Trial of Cancer Vaccine Tedopi® in Lung Cancer
- AbbVie and OSE Immunotherapeutics Announce Partnership to Develop a Novel Monoclonal Antibody for the Treatment of Chronic Inflammation
- OSE Immunotherapeutics Announces New Public Grant to Support Innovation and Research Programs in the Field of RNA Therapeutics
- OSE Immunotherapeutics Announces Publication in Frontiers in Immunology on OSE-230, its Novel Agonist Therapy in Chronic Inflammation
- OSE Immunotherapeutics and Nantes University Hospital Announce Completion of Patient Enrollment in the FIRsT Clinical Trial, a Phase 1/2 Study Evaluating FR104/VEL-101 Immunotherapy in Renal Transplantation
About author
Online


Add a comment
Comments
0 comments on the analysis OSE IMMUNO - 1H