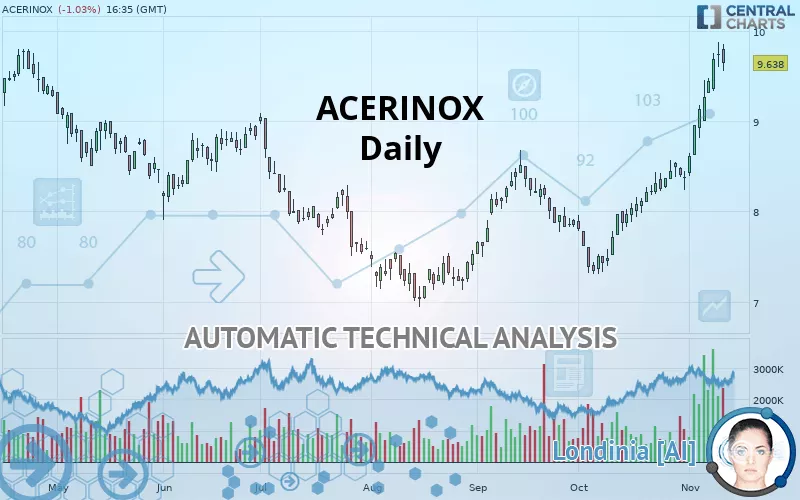
ACERINOX - Daily - Technical analysis published on 11/12/2019 (GMT)
- 326
- 0
- Who voted?
Click here for a new analysis!
- Timeframe : Daily
- - Analysis generated on
- Status : TARGET REACHED

Summary of the analysis

Additional analysis
Quotes
The ACERINOX price is 9.638 EUR. The price is lower by -1.03% since the last closing and was traded between 9.548 EUR and 9.850 EUR over the period. The price is currently at +0.94% from its lowest and -2.15% from its highest.A bullish opening was detected by the Central Gaps scanner. Buyers are trying to impose a bullish momentum in the very short term.
Bullish opening
Type : Bullish
Timeframe : Openning
So that you have an overall view of the price change, here is a table showing the variations over several periods:
Near a new HIGH record (1st january)
Type : Bullish
Timeframe : Weekly
Near a new HIGH record (1 month)
Type : Bullish
Timeframe : Weekly
The Central Volumes scanner notes the presence of abnormal volumes:
Abnormal volumes
Timeframe : 5 days
Technical
Technical analysis of ACERINOX in Daily shows a strongly overall bullish trend. The signals given by the moving averages are 92.86% bullish. This strong bullish trend is confirmed by the strong signals currently being given by short-term moving averages. There is no crossing of moving average by the price or crossing of moving averages between themselves.
An assessment of technical indicators shows a strong bullish signal.
Caution: the Central Indicators scanner currently detects an excess:
RSI indicator is overbought : over 80
Type : Neutral
Timeframe : Daily
CCI indicator is overbought : over 100
Type : Neutral
Timeframe : Daily
Williams %R indicator is overbought : over -20
Type : Neutral
Timeframe : Daily
Price is back over the pivot point
Type : Bullish
Timeframe : Weekly
The Central Patterns scanner, which studies chart patterns, resistances and supports, has identified this signal:
Near resistance of channel
Type : Bearish
Timeframe : Daily
Central Candlesticks, the scanner specialised in Japanese candlesticks, detects this inversion signal that could impact the current short-term trend:
Doji
Type : Neutral
Timeframe : Daily
| S3 | S2 | S1 | Price | R1 | R2 | R3 | |
|---|---|---|---|---|---|---|---|
| ProTrendLines | 8.176 | 8.516 | 9.043 | 9.638 | 9.755 | 10.647 | 12.464 |
| Change (%) | -15.17% | -11.64% | -6.17% | - | +1.21% | +10.47% | +29.32% |
| Change | -1.462 | -1.122 | -0.595 | - | +0.117 | +1.009 | +2.826 |
| Level | Major | Major | Intermediate | - | Major | Major | Intermediate |
Attention could also be paid to pivot points to set price objectives:
| Pivot points | S3 | S2 | S1 | PP | R1 | R2 | R3 |
|---|---|---|---|---|---|---|---|
| Standard | 9.330 | 9.466 | 9.602 | 9.738 | 9.874 | 10.010 | 10.146 |
| Camarilla | 9.663 | 9.688 | 9.713 | 9.738 | 9.763 | 9.788 | 9.813 |
| Woodie | 9.330 | 9.466 | 9.602 | 9.738 | 9.874 | 10.010 | 10.146 |
| Fibonacci | 9.466 | 9.570 | 9.634 | 9.738 | 9.842 | 9.906 | 10.010 |
| Pivot points | S3 | S2 | S1 | PP | R1 | R2 | R3 |
|---|---|---|---|---|---|---|---|
| Standard | 7.825 | 8.223 | 8.953 | 9.351 | 10.081 | 10.479 | 11.209 |
| Camarilla | 9.374 | 9.477 | 9.581 | 9.684 | 9.787 | 9.891 | 9.994 |
| Woodie | 7.992 | 8.306 | 9.120 | 9.434 | 10.248 | 10.562 | 11.376 |
| Fibonacci | 8.223 | 8.654 | 8.920 | 9.351 | 9.782 | 10.048 | 10.479 |
| Pivot points | S3 | S2 | S1 | PP | R1 | R2 | R3 |
|---|---|---|---|---|---|---|---|
| Standard | 6.325 | 6.813 | 7.595 | 8.083 | 8.865 | 9.353 | 10.135 |
| Camarilla | 8.029 | 8.145 | 8.262 | 8.378 | 8.494 | 8.611 | 8.727 |
| Woodie | 6.473 | 6.887 | 7.743 | 8.157 | 9.013 | 9.427 | 10.283 |
| Fibonacci | 6.813 | 7.298 | 7.598 | 8.083 | 8.568 | 8.868 | 9.353 |
Numerical data
The following are the details of the technical indicators and moving averages that were collected to generate this technical analysis:
| RSI (14): | 79.23 | |
| MACD (12,26,9): | 0.4420 | |
| Directional Movement: | 33.859 | |
| AROON (14): | 92.857 | |
| DEMA (21): | 9.356 | |
| Parabolic SAR (0,02-0,02-0,2): | 8.835 | |
| Elder Ray (13): | 0.616 | |
| Super Trend (3,10): | 8.955 | |
| Zig ZAG (10): | 9.638 | |
| VORTEX (21): | 1.3350 | |
| Stochastique (14,3,5): | 91.16 | |
| TEMA (21): | 9.642 | |
| Williams %R (14): | -14.34 | |
| Chande Momentum Oscillator (20): | 1.272 | |
| Repulse (5,40,3): | 2.0900 | |
| ROCnROLL: | 1 | |
| TRIX (15,9): | 0.5600 | |
| Courbe Coppock: | 28.50 |
| MA7: | 9.407 | |
| MA20: | 8.691 | |
| MA50: | 8.243 | |
| MA100: | 7.998 | |
| MAexp7: | 9.391 | |
| MAexp20: | 8.835 | |
| MAexp50: | 8.368 | |
| MAexp100: | 8.230 | |
| Price / MA7: | +2.46% | |
| Price / MA20: | +10.90% | |
| Price / MA50: | +16.92% | |
| Price / MA100: | +20.51% | |
| Price / MAexp7: | +2.63% | |
| Price / MAexp20: | +9.09% | |
| Price / MAexp50: | +15.18% | |
| Price / MAexp100: | +17.11% |
News
The last news published on ACERINOX at the time of the generation of this analysis was as follows:
 Acerinox
About author

Online


Add a comment
Comments
0 comments on the analysis ACERINOX - Daily