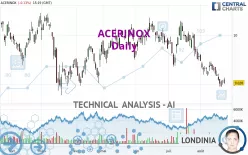
ACERINOX - Daily - Technical analysis published on 08/23/2023 (GMT)
- 168
- 0
Click here for a new analysis!
- Timeframe : Daily
- - Analysis generated on
- Status : LEVEL MAINTAINED

Summary of the analysis

Additional analysis
Quotes
ACERINOX rating 9.028 EUR. The price registered a decrease of -0.13% on the session and was between 9.002 EUR and 9.134 EUR. This implies that the price is at +0.29% from its lowest and at -1.16% from its highest.The Central Gaps scanner detects a bullish gap which is a sign that buyers have taken the lead in the very short term.
Opening Gap UP
Type : Bullish
Timeframe : Openning
A study of price movements over other periods shows the following variations:
Near a new LOW record (1 month)
Type : Bearish
Timeframe : Weekly
Technical
Technical analysis of this Daily chart of ACERINOX indicates that the overall trend is strongly bearish. The signals given by moving averages are 85.71% bearish. This strong bearish trend is confirmed by the strong signals currently being given by short-term moving averages. The Central Indicators scanner does not detect any result on moving averages that would impact this trend.
An assessment of technical indicators does not currently provide any relevant information to suggest whether the signal given by the technical indicators is more bullish or bearish.
But beware of excesses. The Central Indicators scanner currently detects this:
CCI indicator is oversold : under -100
Type : Neutral
Timeframe : Daily
Williams %R indicator is oversold : under -80
Type : Neutral
Timeframe : Daily
Price is back under the pivot point
Type : Bearish
Timeframe : Daily
An analysis of the price chart with the Central Patterns scanner (detector of chart patterns and resistances and supports) shows a result that can have an impact on the price change:
Near support of channel
Type : Bullish
Timeframe : Daily
No result was found by the Central Candlesticks scanner on Japanese candlesticks.
| S3 | S2 | S1 | Price | R1 | R2 | R3 | |
|---|---|---|---|---|---|---|---|
| ProTrendLines | 8.477 | 8.715 | 8.917 | 9.028 | 9.122 | 9.424 | 9.799 |
| Change (%) | -6.10% | -3.47% | -1.23% | - | +1.04% | +4.39% | +8.54% |
| Change | -0.551 | -0.313 | -0.111 | - | +0.094 | +0.396 | +0.771 |
| Level | Major | Intermediate | Major | - | Major | Intermediate | Major |
Attention could also be paid to pivot points to set price objectives:
| Pivot points | S3 | S2 | S1 | PP | R1 | R2 | R3 |
|---|---|---|---|---|---|---|---|
| Standard | 8.895 | 8.943 | 8.991 | 9.039 | 9.087 | 9.135 | 9.183 |
| Camarilla | 9.014 | 9.022 | 9.031 | 9.040 | 9.049 | 9.058 | 9.066 |
| Woodie | 8.896 | 8.943 | 8.992 | 9.039 | 9.088 | 9.135 | 9.184 |
| Fibonacci | 8.943 | 8.979 | 9.002 | 9.039 | 9.075 | 9.098 | 9.135 |
| Pivot points | S3 | S2 | S1 | PP | R1 | R2 | R3 |
|---|---|---|---|---|---|---|---|
| Standard | 8.432 | 8.692 | 8.852 | 9.112 | 9.272 | 9.532 | 9.692 |
| Camarilla | 8.897 | 8.935 | 8.974 | 9.012 | 9.051 | 9.089 | 9.128 |
| Woodie | 8.382 | 8.667 | 8.802 | 9.087 | 9.222 | 9.507 | 9.642 |
| Fibonacci | 8.692 | 8.852 | 8.952 | 9.112 | 9.272 | 9.372 | 9.532 |
| Pivot points | S3 | S2 | S1 | PP | R1 | R2 | R3 |
|---|---|---|---|---|---|---|---|
| Standard | 7.786 | 8.433 | 9.002 | 9.649 | 10.218 | 10.865 | 11.434 |
| Camarilla | 9.238 | 9.349 | 9.461 | 9.572 | 9.684 | 9.795 | 9.906 |
| Woodie | 7.748 | 8.414 | 8.964 | 9.630 | 10.180 | 10.846 | 11.396 |
| Fibonacci | 8.433 | 8.897 | 9.184 | 9.649 | 10.113 | 10.400 | 10.865 |
Numerical data
The following are the details of the technical indicators and moving averages that were collected to generate this technical analysis:
| RSI (14): | 35.28 | |
| MACD (12,26,9): | -0.1670 | |
| Directional Movement: | -15.266 | |
| AROON (14): | -50.000 | |
| DEMA (21): | 9.067 | |
| Parabolic SAR (0,02-0,02-0,2): | 9.205 | |
| Elder Ray (13): | -0.111 | |
| Super Trend (3,10): | 9.482 | |
| Zig ZAG (10): | 9.024 | |
| VORTEX (21): | 0.6860 | |
| Stochastique (14,3,5): | 10.68 | |
| TEMA (21): | 8.961 | |
| Williams %R (14): | -85.55 | |
| Chande Momentum Oscillator (20): | -0.314 | |
| Repulse (5,40,3): | -2.6680 | |
| ROCnROLL: | 2 | |
| TRIX (15,9): | -0.2140 | |
| Courbe Coppock: | 7.70 |
| MA7: | 9.072 | |
| MA20: | 9.284 | |
| MA50: | 9.551 | |
| MA100: | 9.490 | |
| MAexp7: | 9.083 | |
| MAexp20: | 9.272 | |
| MAexp50: | 9.443 | |
| MAexp100: | 9.442 | |
| Price / MA7: | -0.49% | |
| Price / MA20: | -2.76% | |
| Price / MA50: | -5.48% | |
| Price / MA100: | -4.87% | |
| Price / MAexp7: | -0.61% | |
| Price / MAexp20: | -2.63% | |
| Price / MAexp50: | -4.39% | |
| Price / MAexp100: | -4.38% |
News
The latest news and videos published on ACERINOX at the time of the analysis were as follows:
About author
Online


Add a comment
Comments
0 comments on the analysis ACERINOX - Daily